Classification
November 18, 2025
Big Picture Recap
- So far, we have focused on prediction/estimation using linear regression.
- We used features (inputs, \(X\)) to predict an outcome (response, \(Y\)).
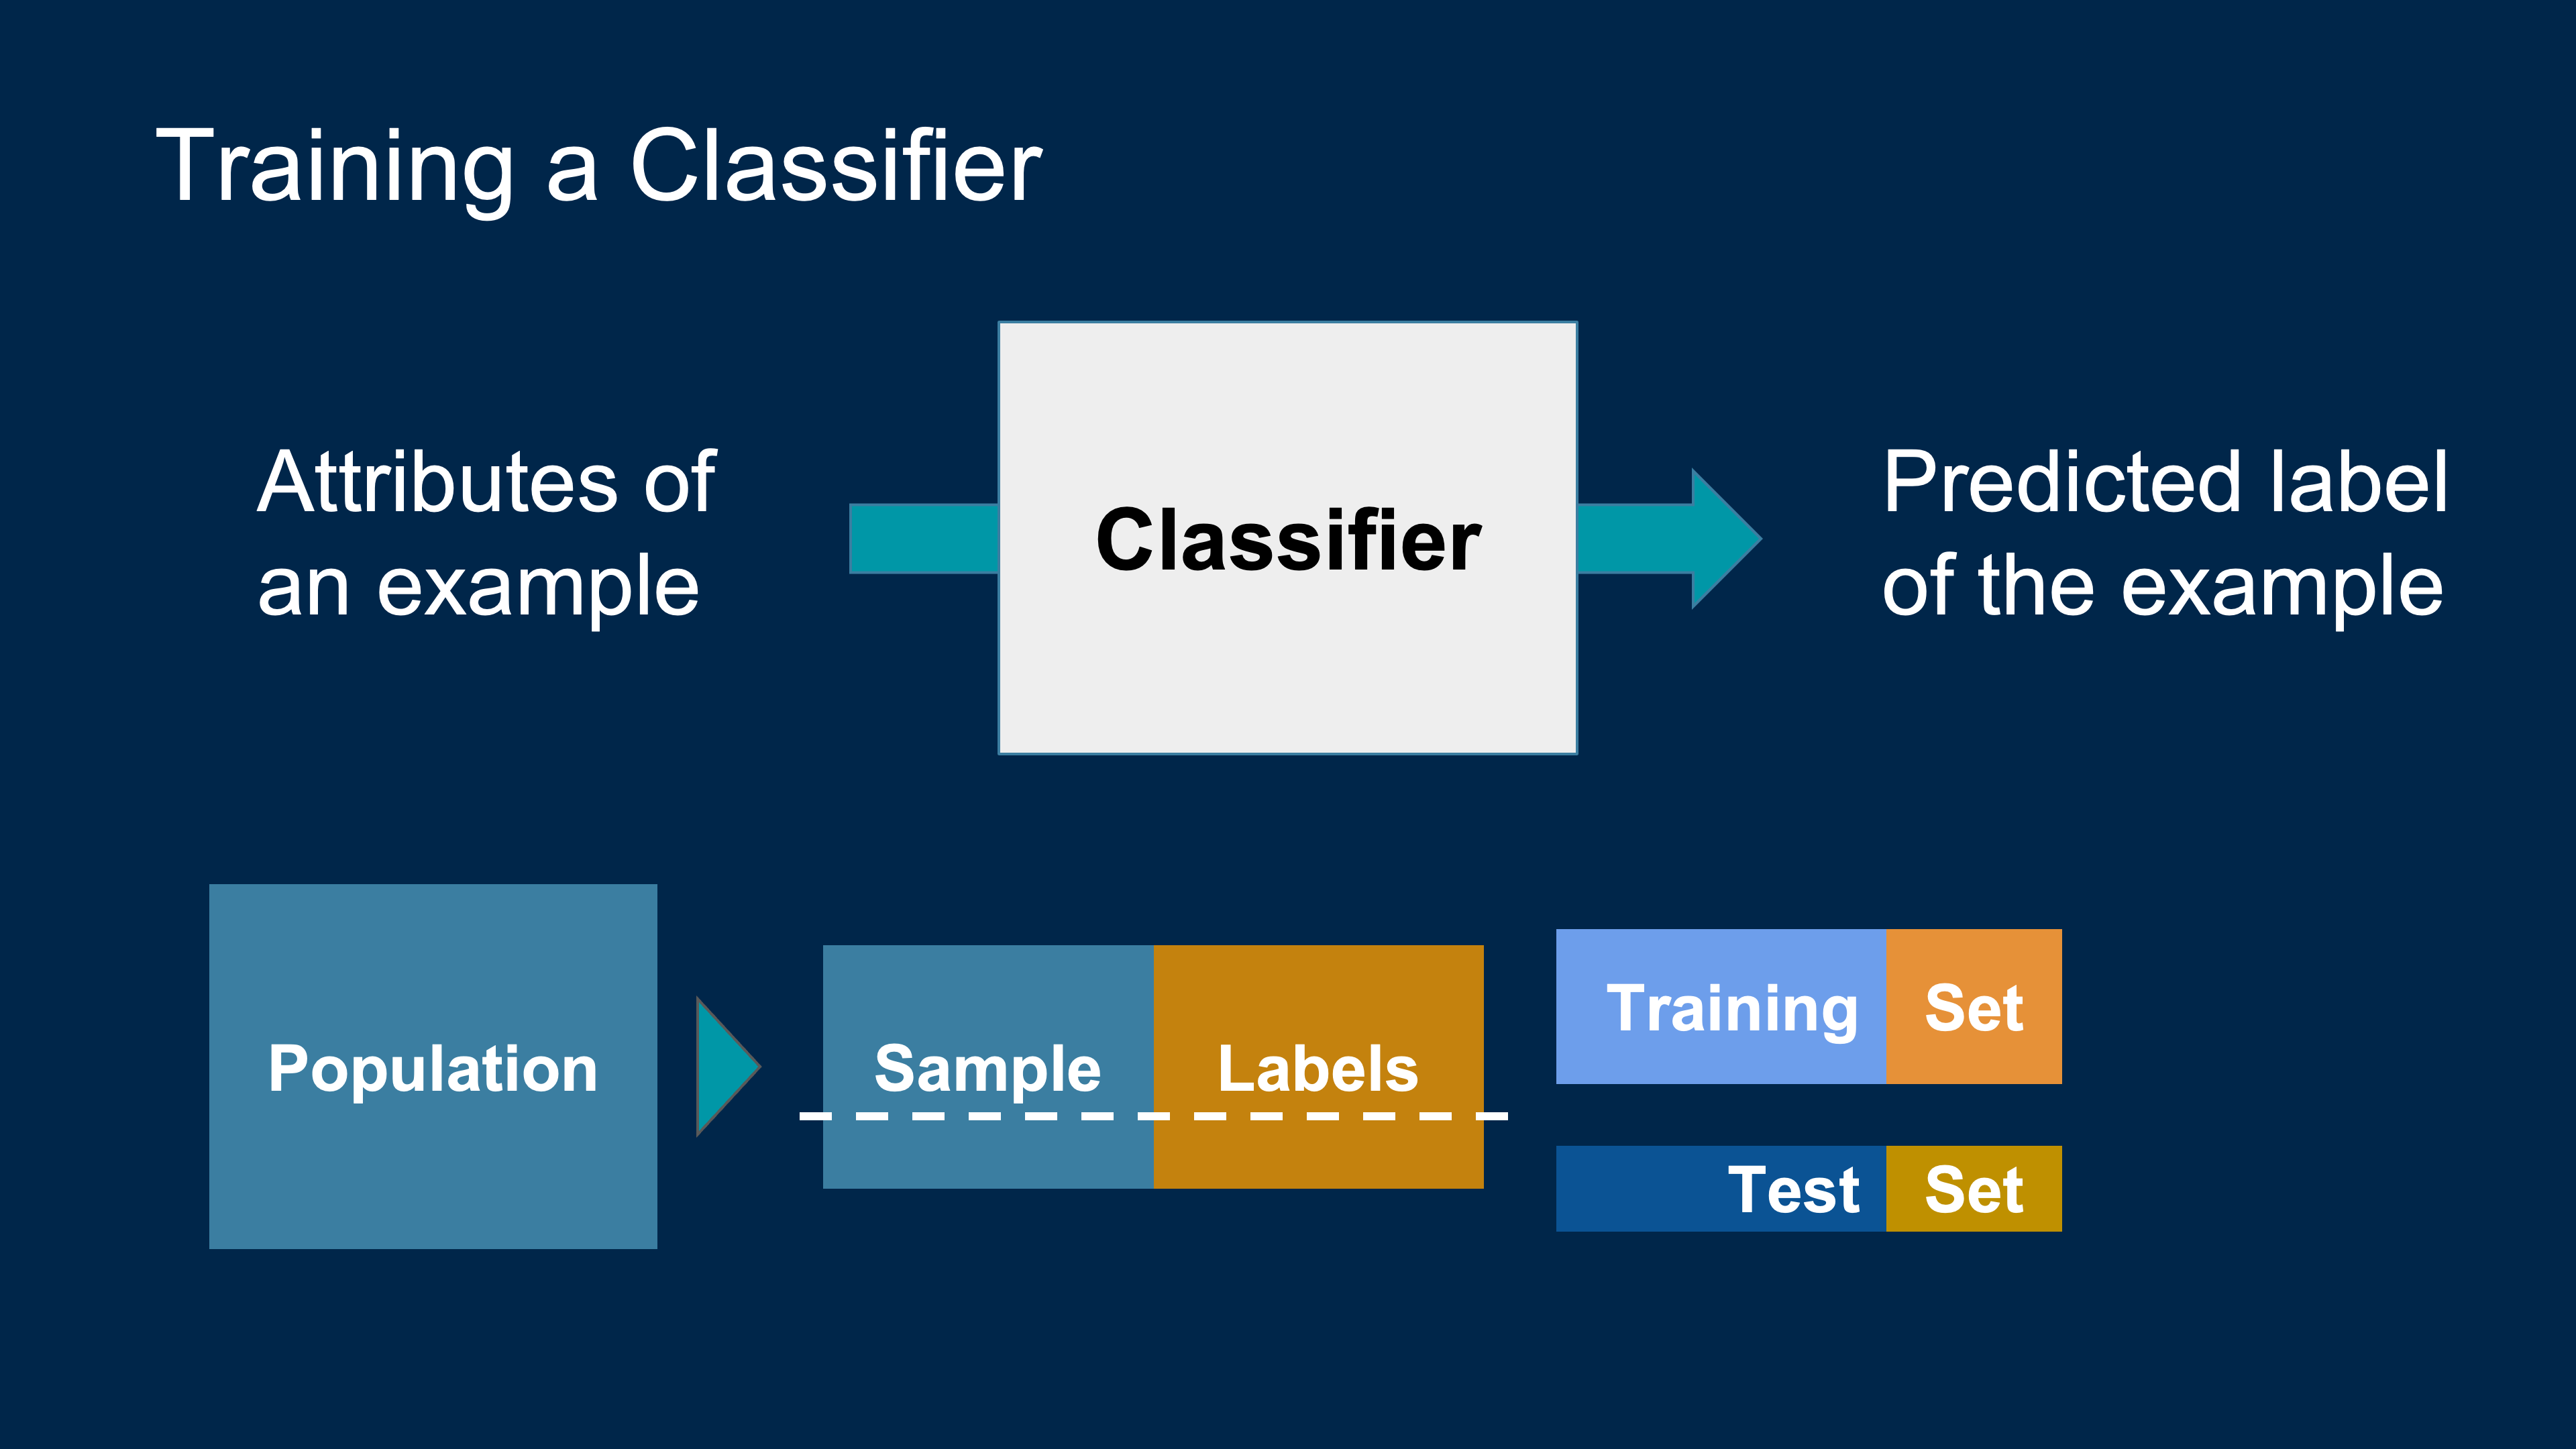
- Today we:
- Connect regression to classification.
- Set up a machine learning framework for training and testing models.
Linear Regression (Recap)
If \(X\) is Categorical
We encode categories as numeric variables.
- Binary category:
- Convert to 0/1 and proceed with regression.
- Example:
Smoker
Smoker = 0 for “No”Smoker = 1 for “Yes”
If \(X\) is Categorical
- Multi-level categorical predictors:
- Use one-hot encoding (indicator / dummy variables).
- Example:
Color with levels: Red, Blue, Green
- Create:
Color_Blue = 1 if Blue, 0 otherwise
Color_Green = 1 if Green, 0 otherwise
- Baseline: Red (when both indicators are 0).
- One-hot encoding turns categories into vectors (e.g., Red = (0,0), Blue = (1,0), Green = (0,1))
Multiple Linear Regression
- Extends simple linear regression to multiple predictors.
- Goal: predict a numeric outcome \(Y\) using several features:
\[\widehat{Y} = b_0 + b_1 X_1 + b_2 X_2 + \dots + b_p X_p\]
model <- lm(exam_score ~ hours_studied + hours_slept, data = my_data)
summary(model)
Many factors can contribute to an outcome.
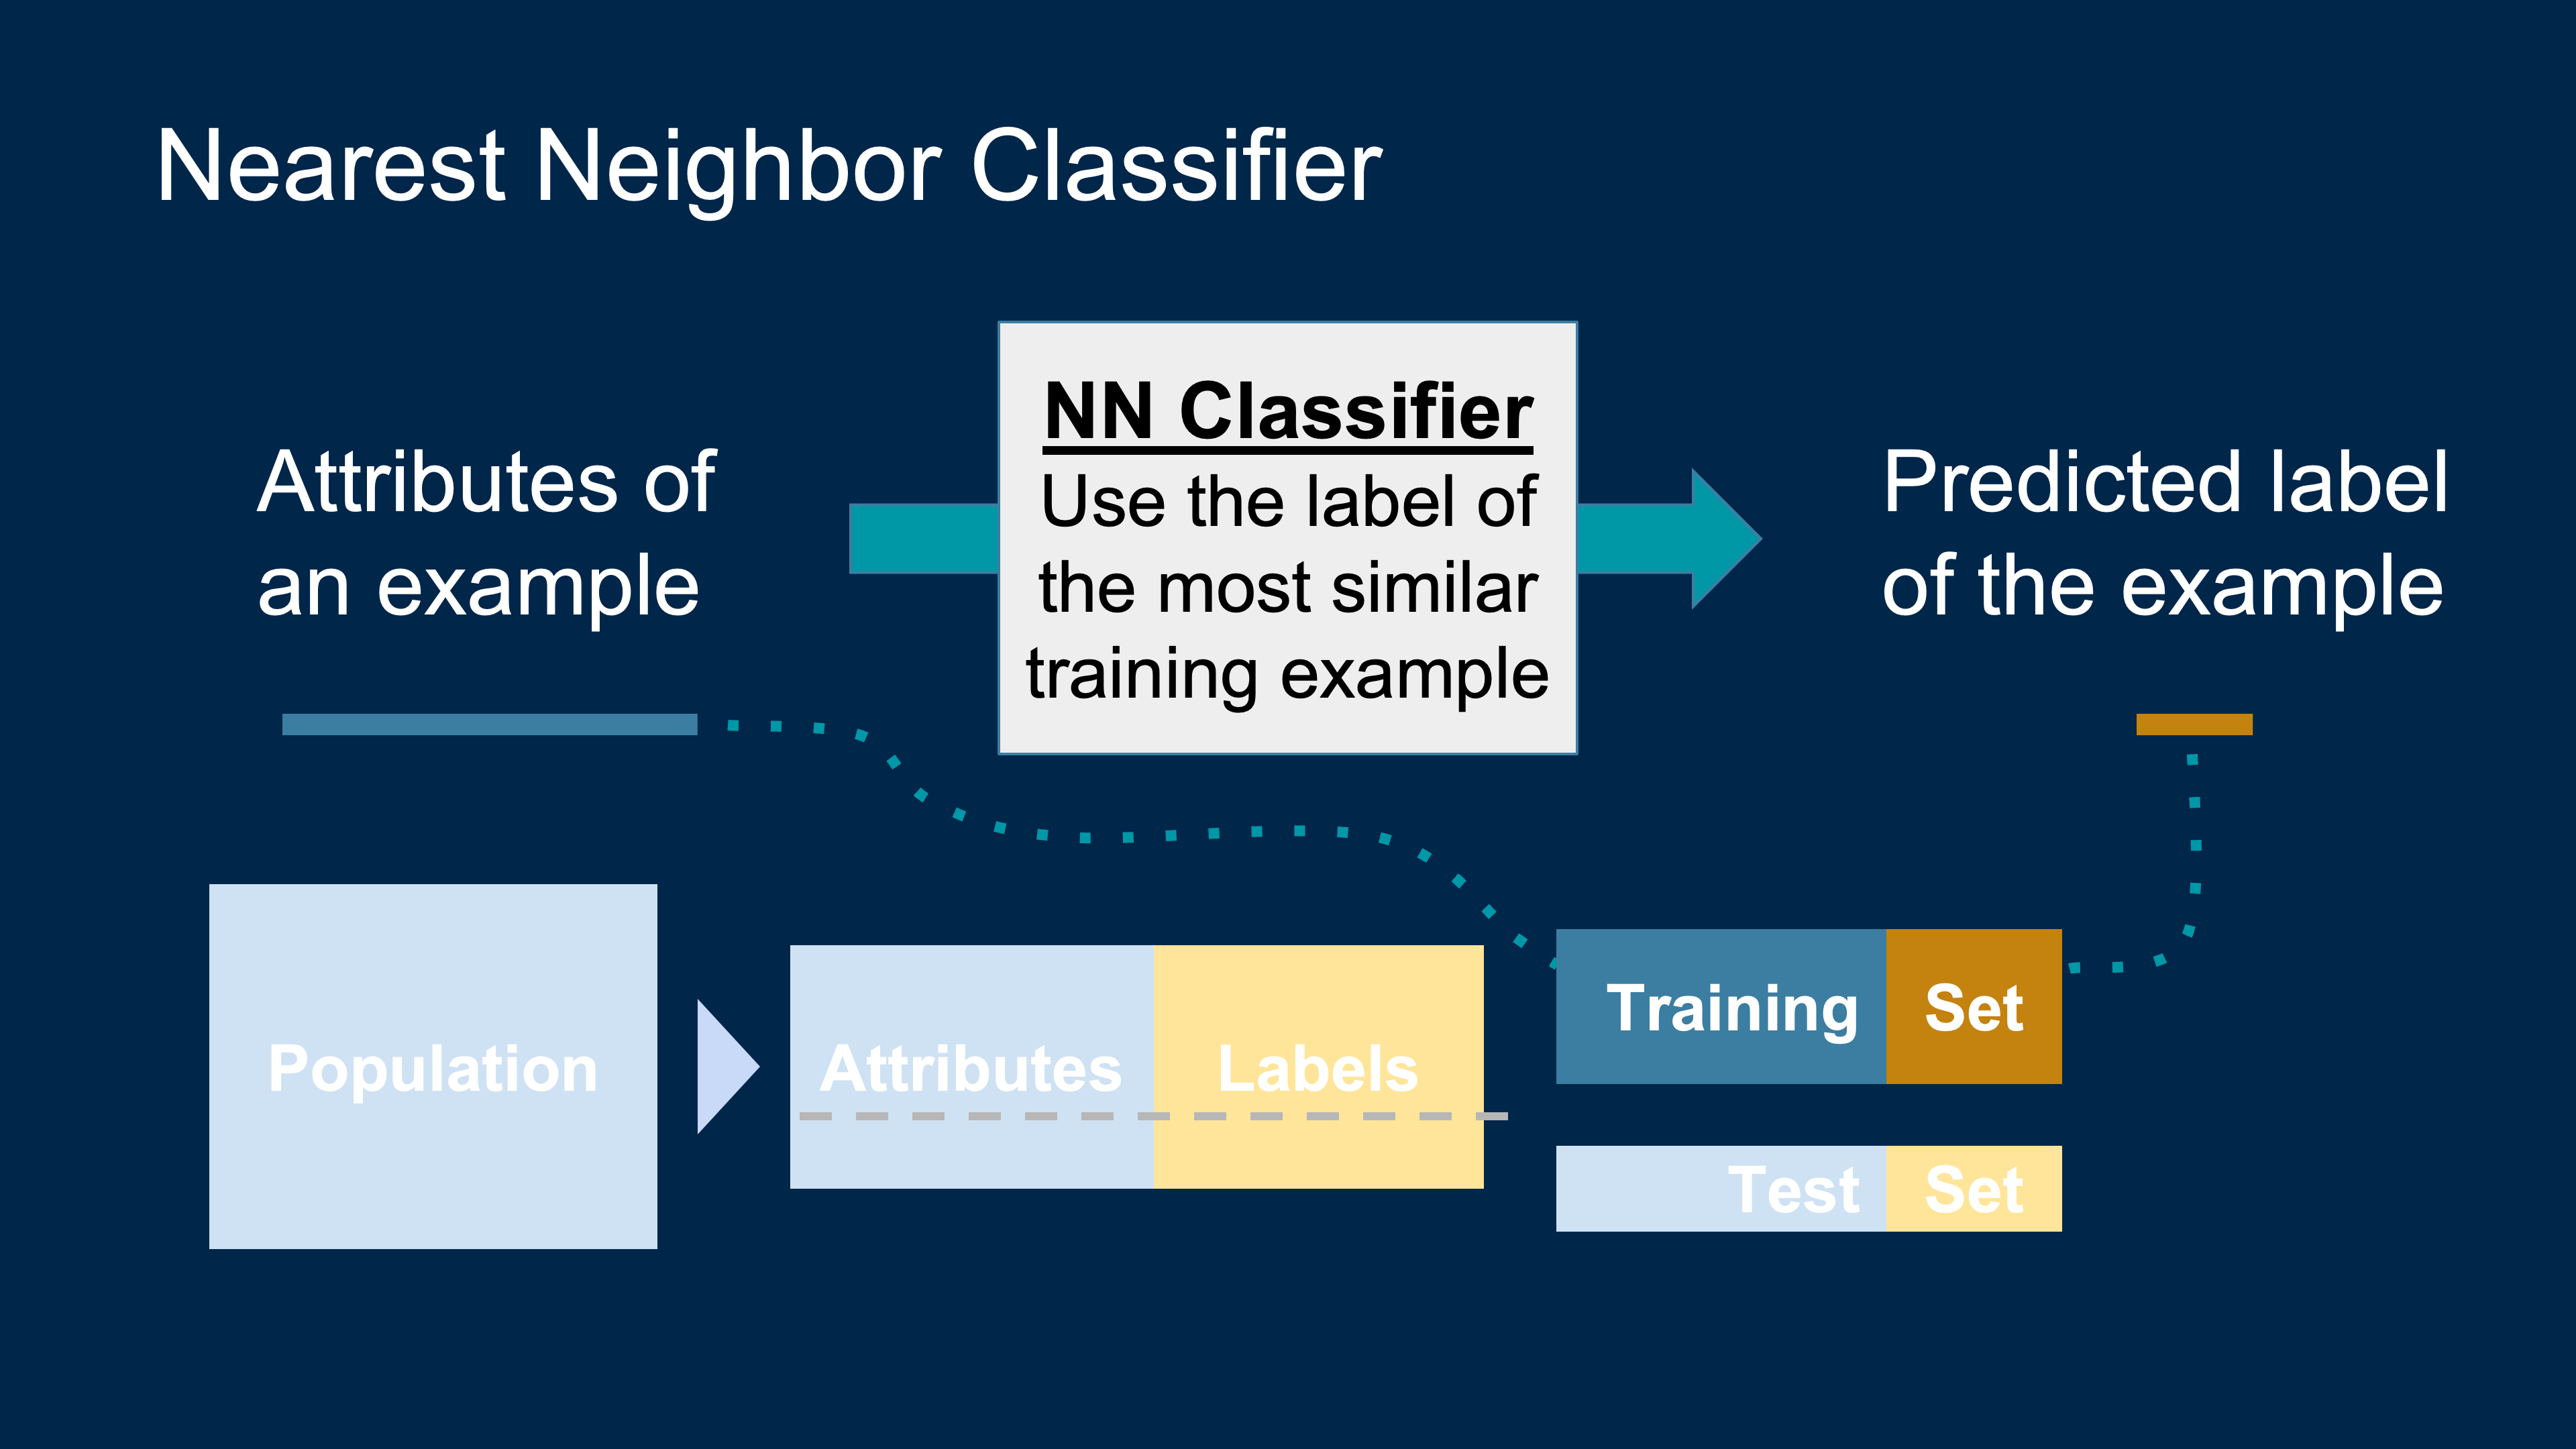
Guessing the Value of a Variable
- Based on incomplete information
- One way of making predictions / estimate:
- To predict an outcome for an individual,
- find others who are like that individual
- and whose outcomes you know.
- Use those outcomes as the basis of your prediction.
- Two Types of Prediction
- Regression = Numeric; Classification = Categorical
Classification
Spam or not spam? Why do you think so?
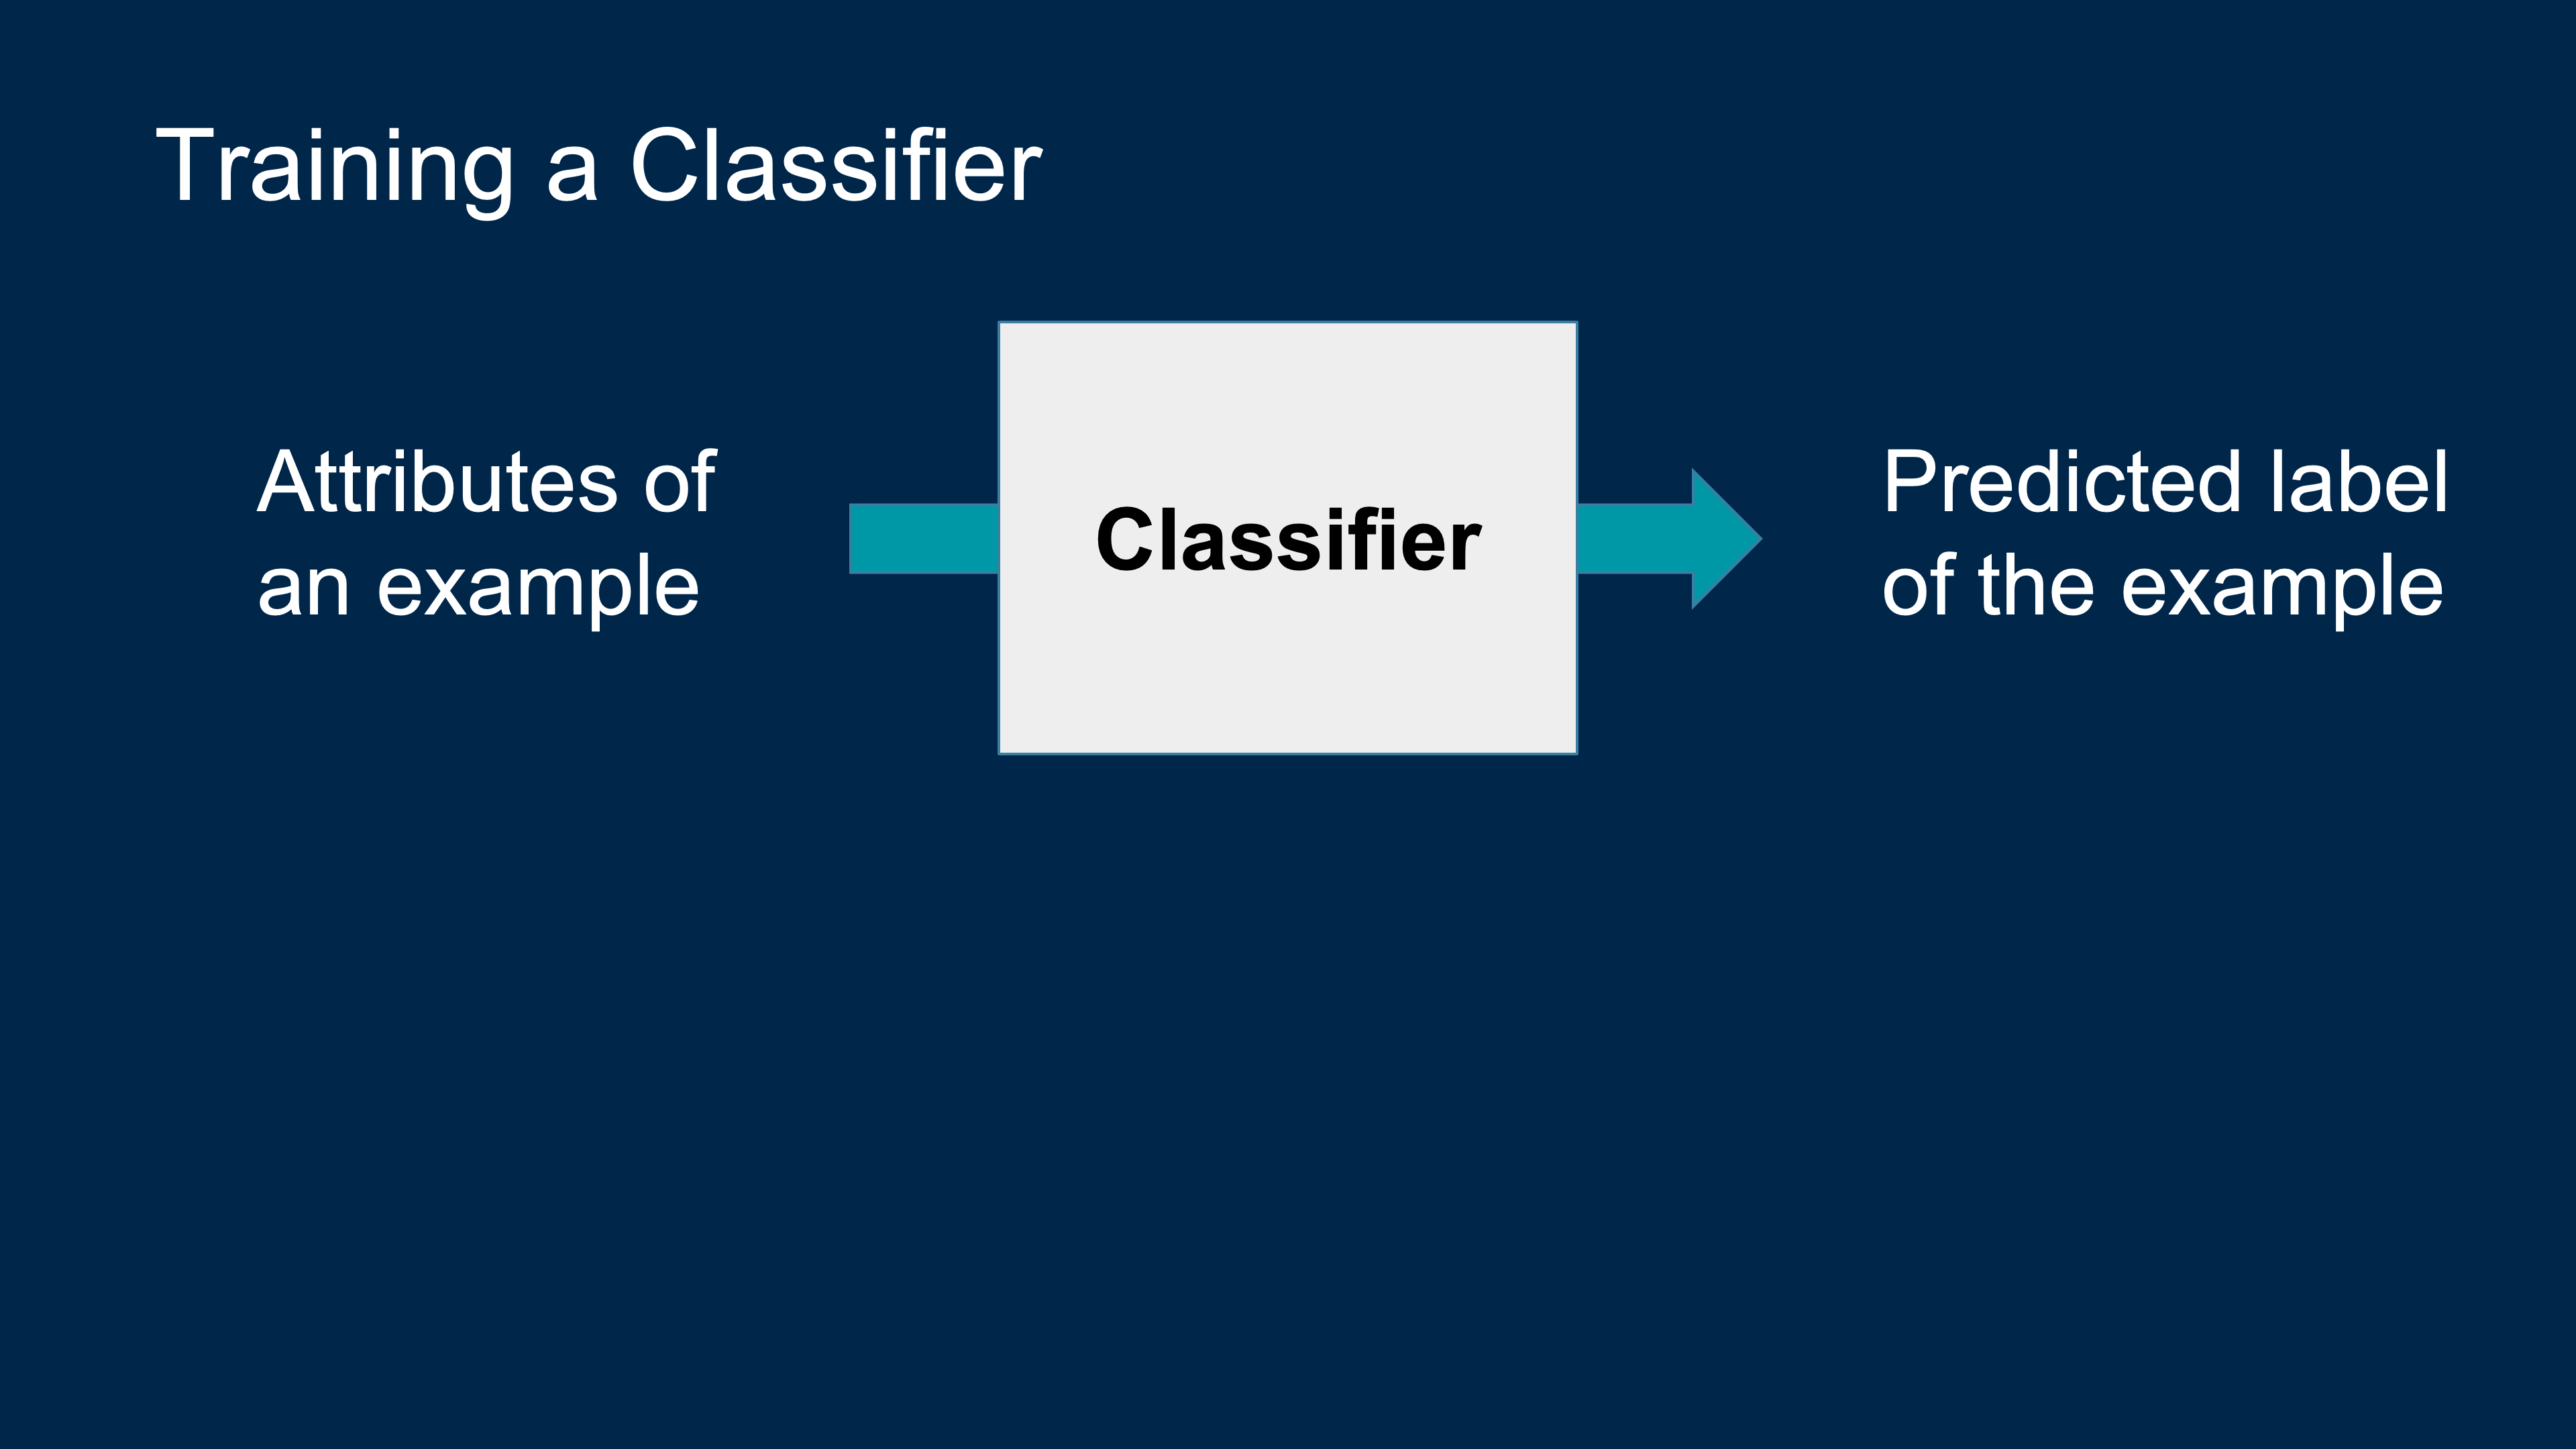
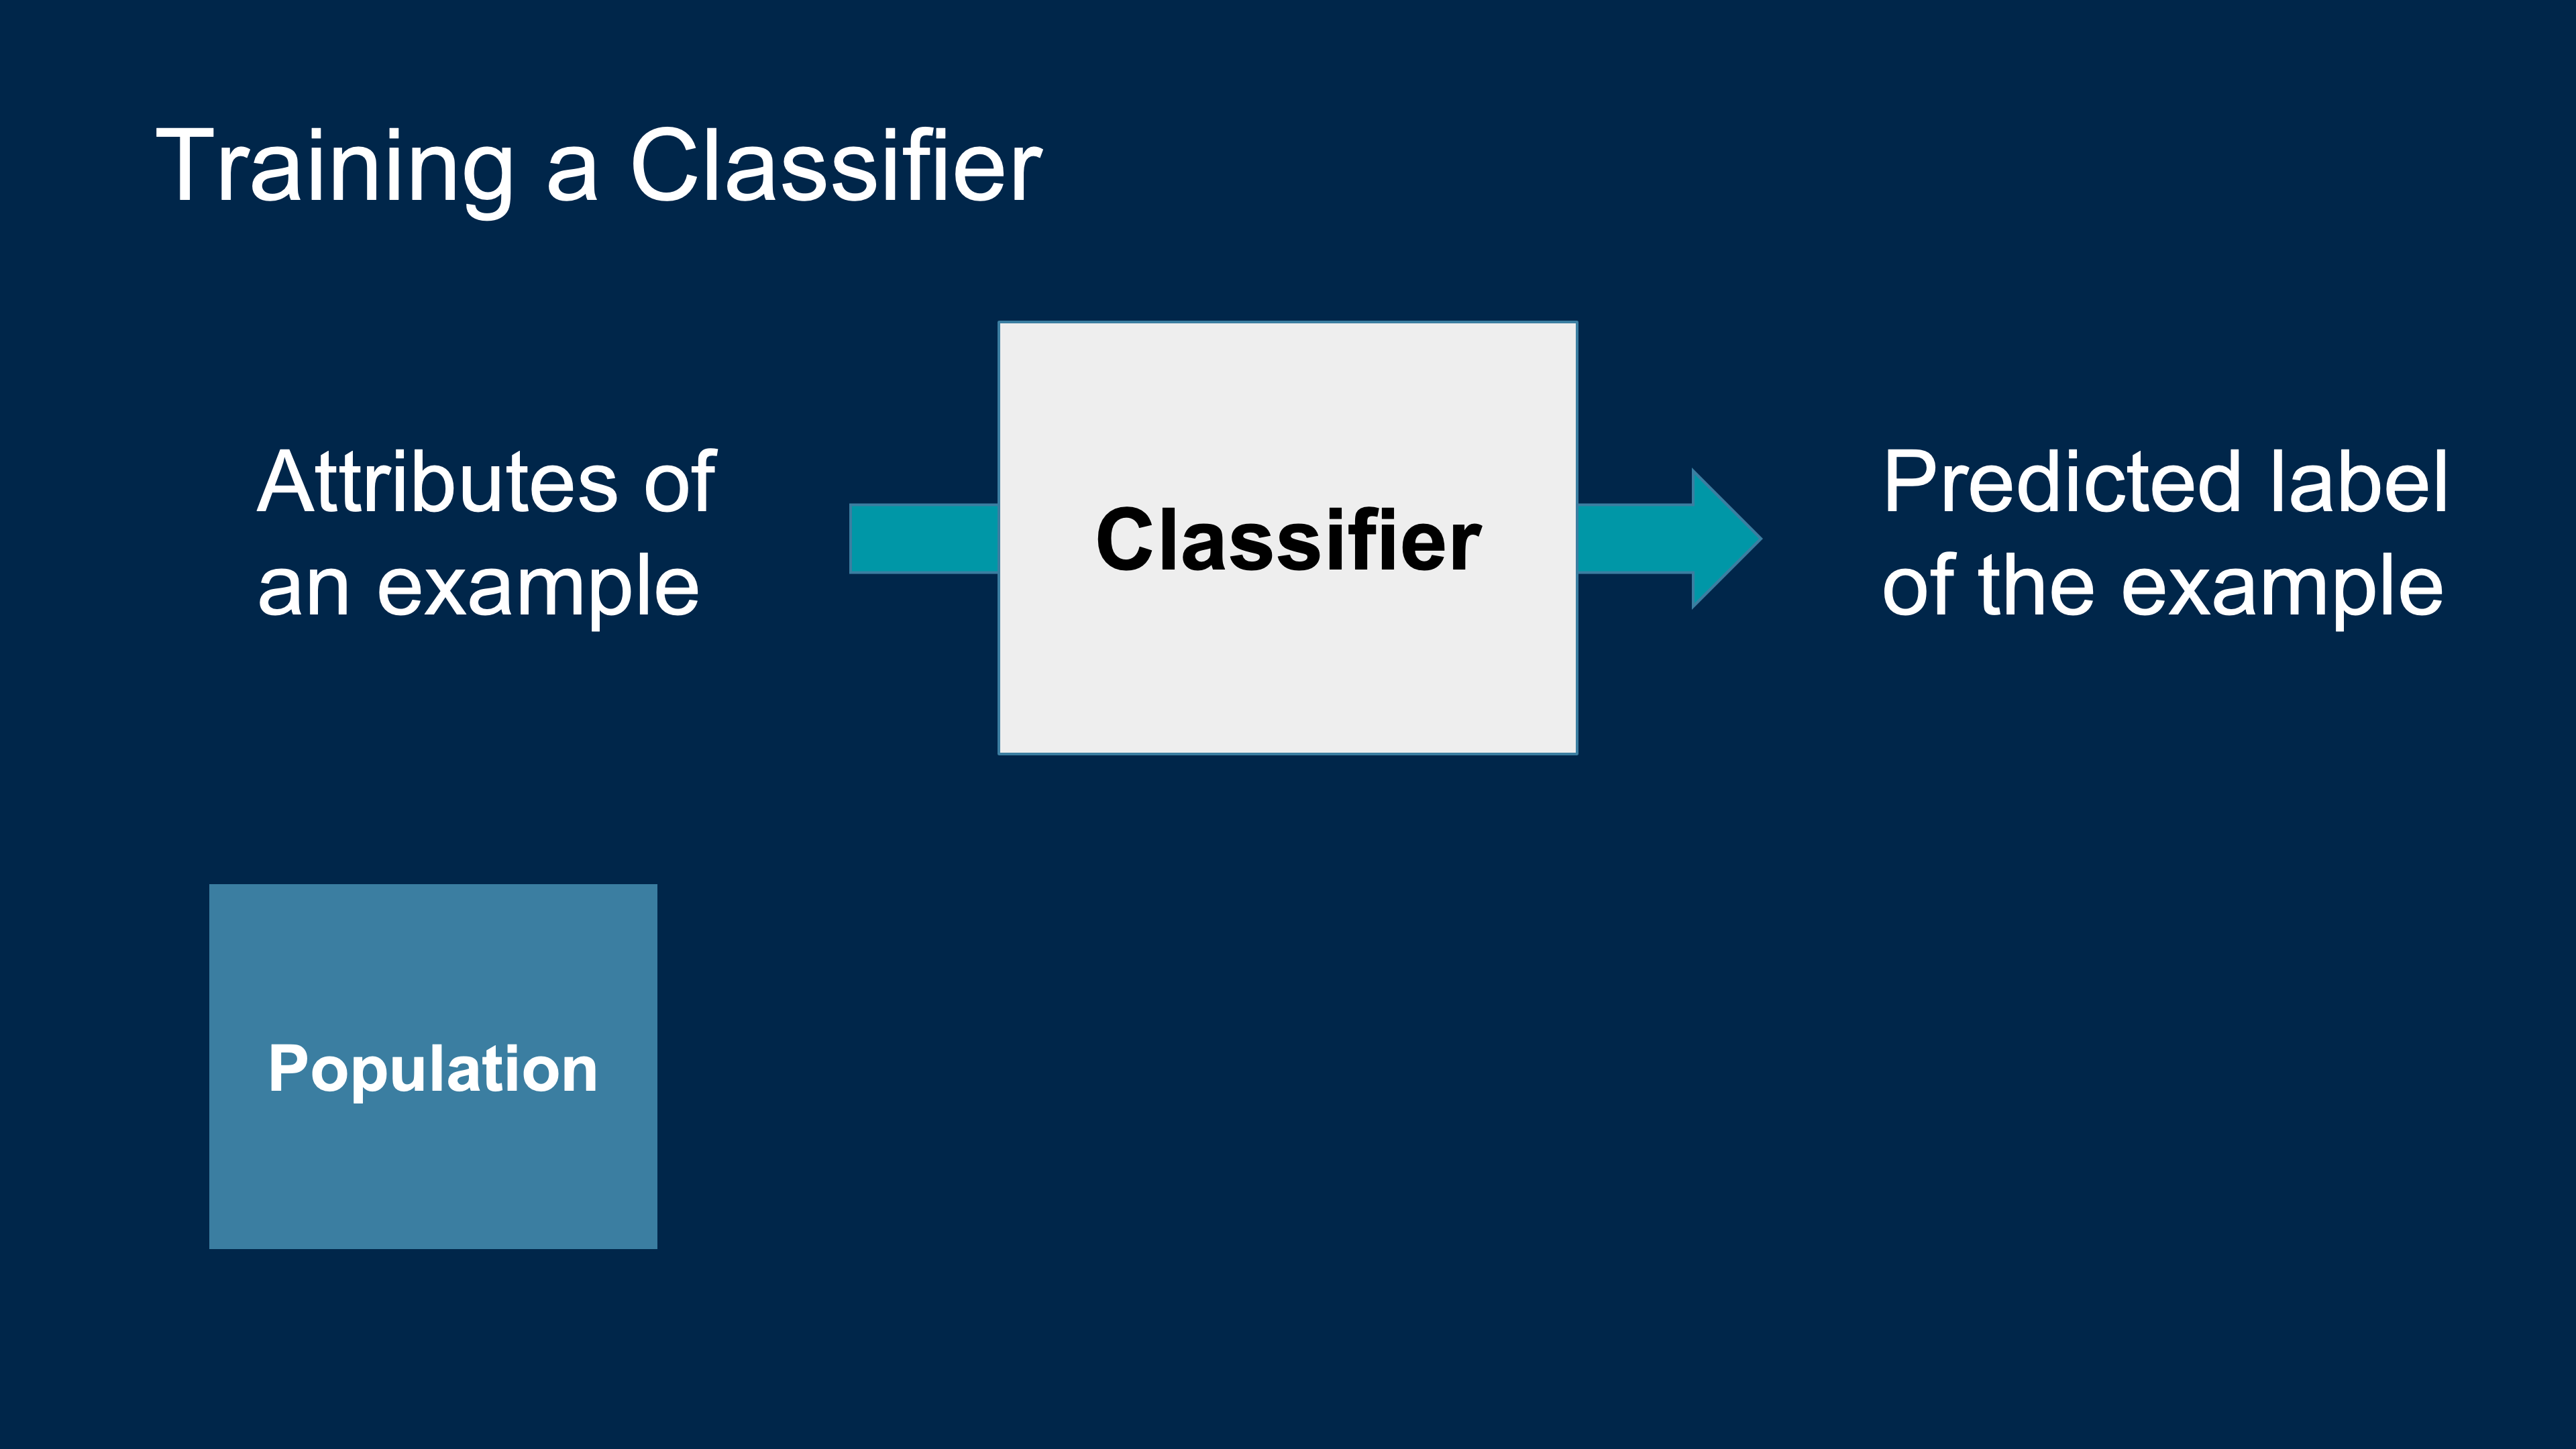
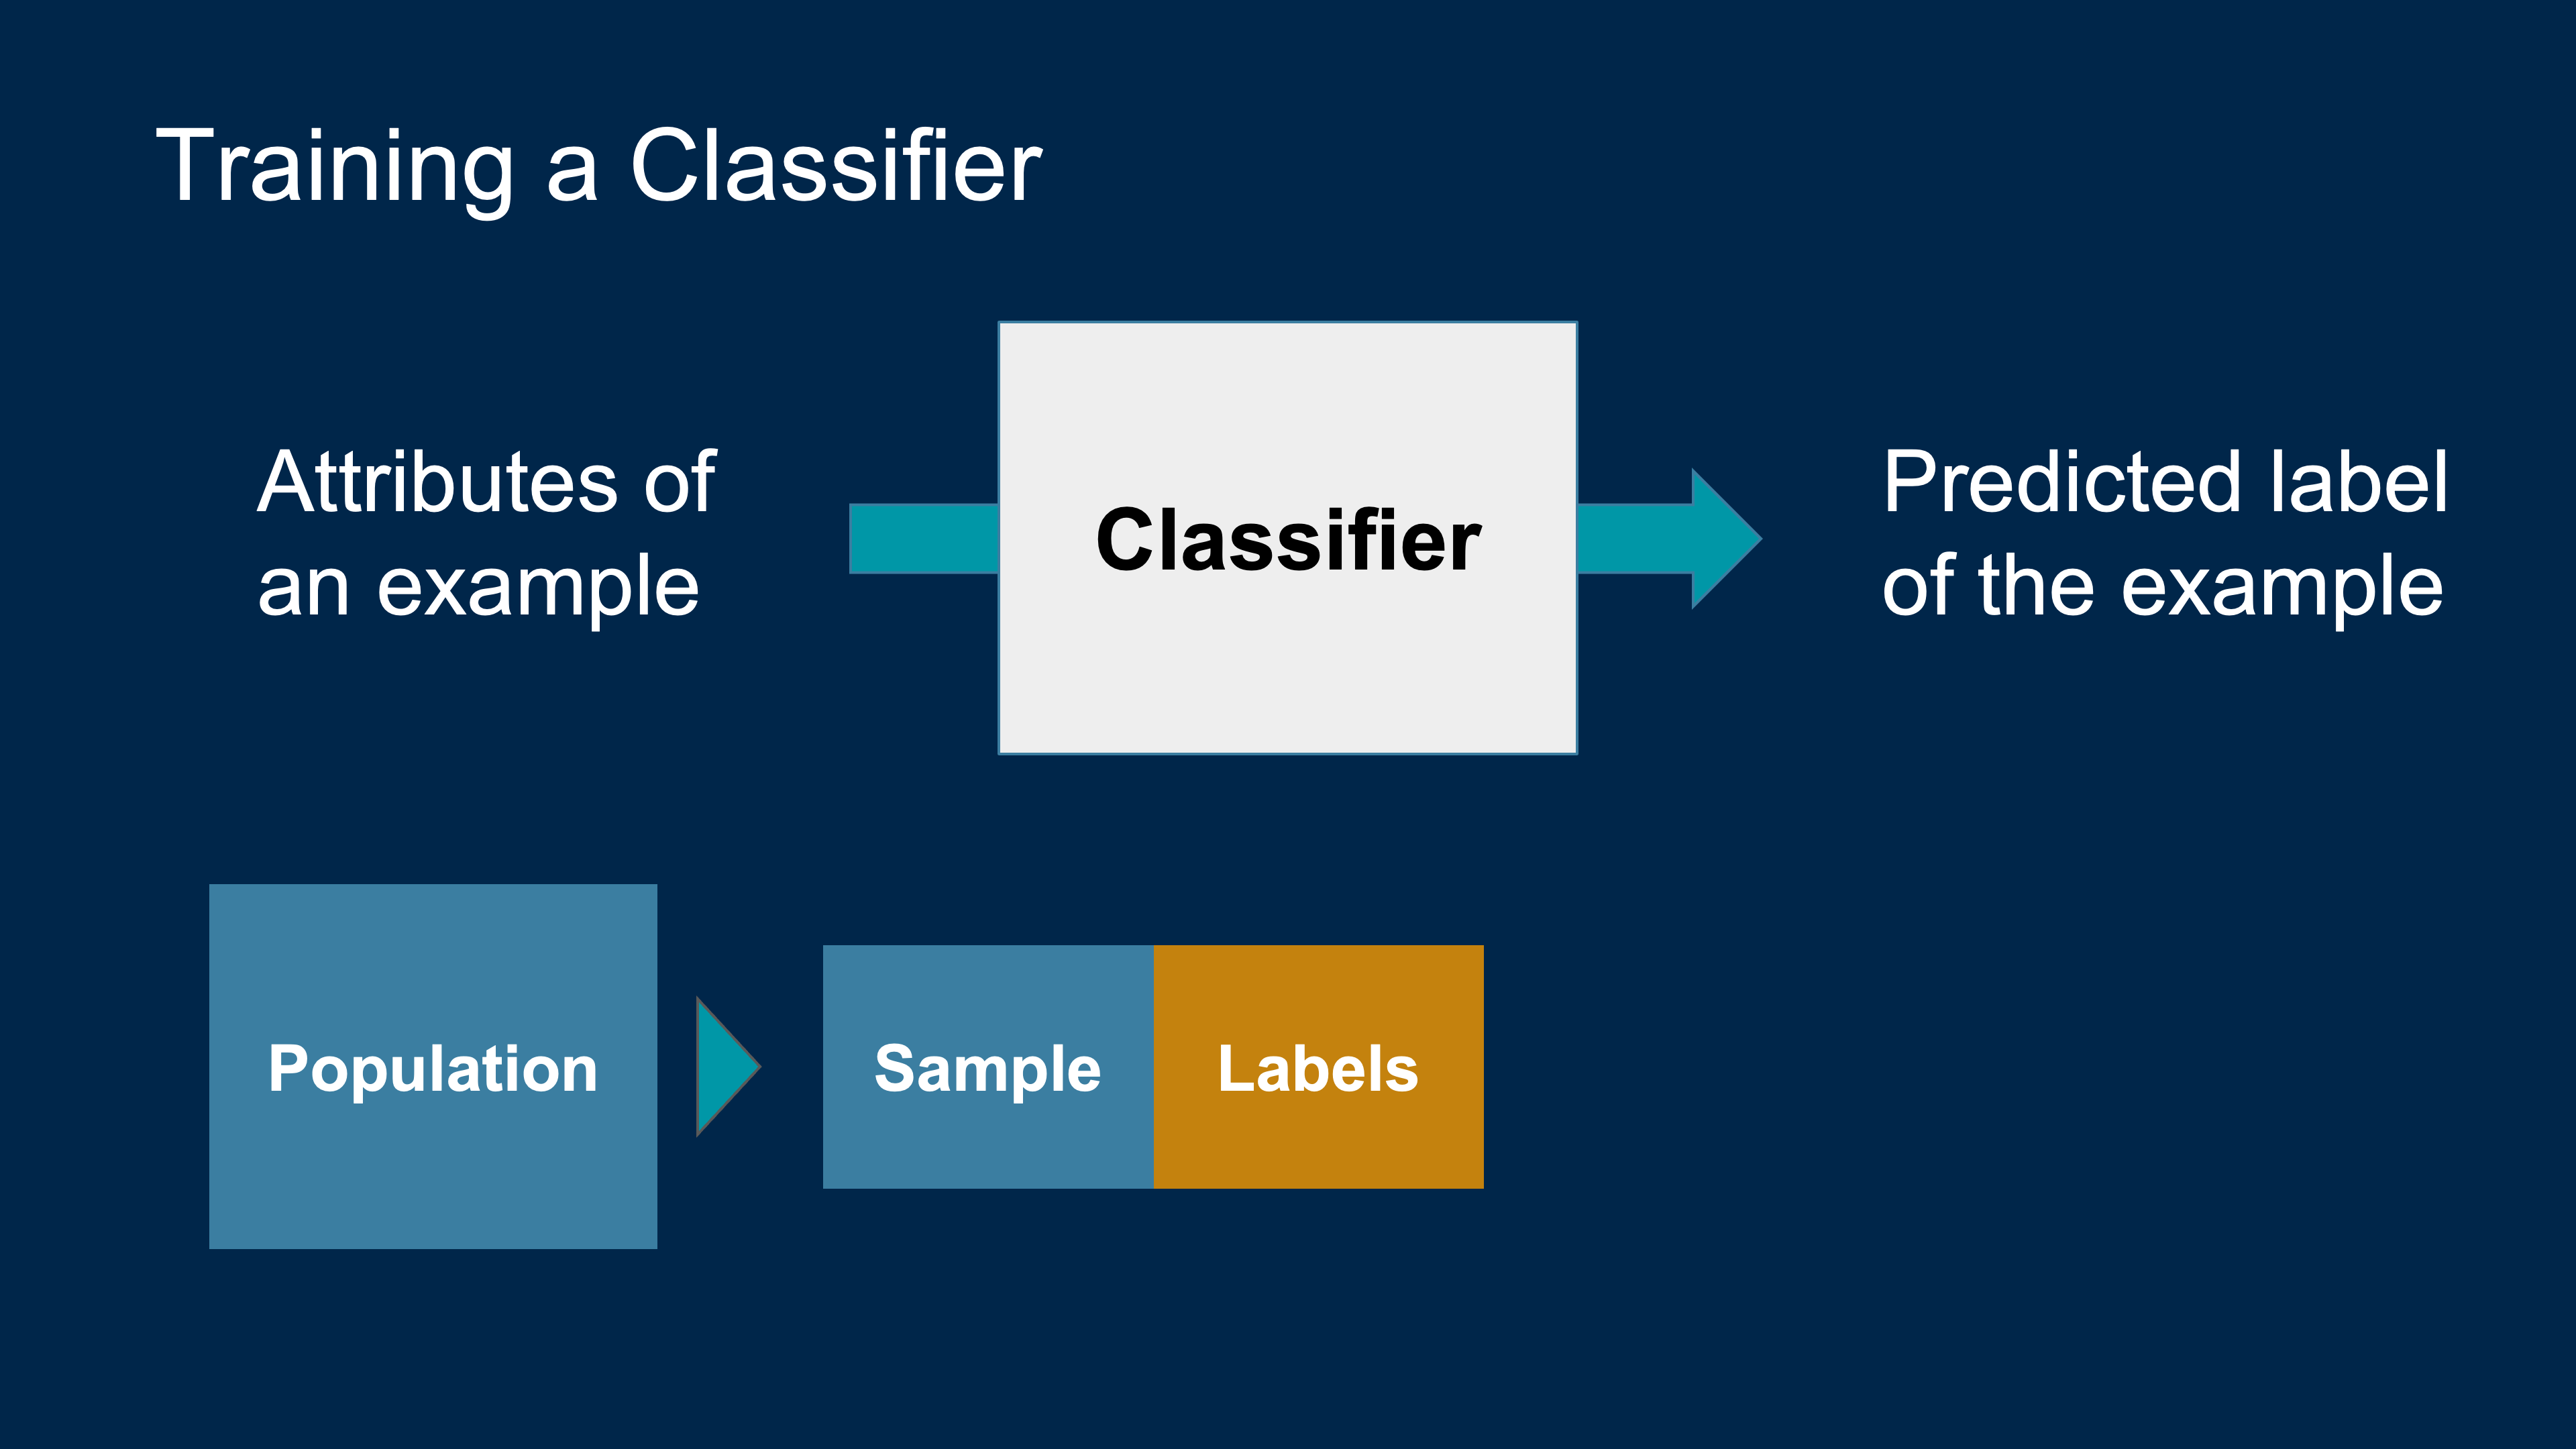
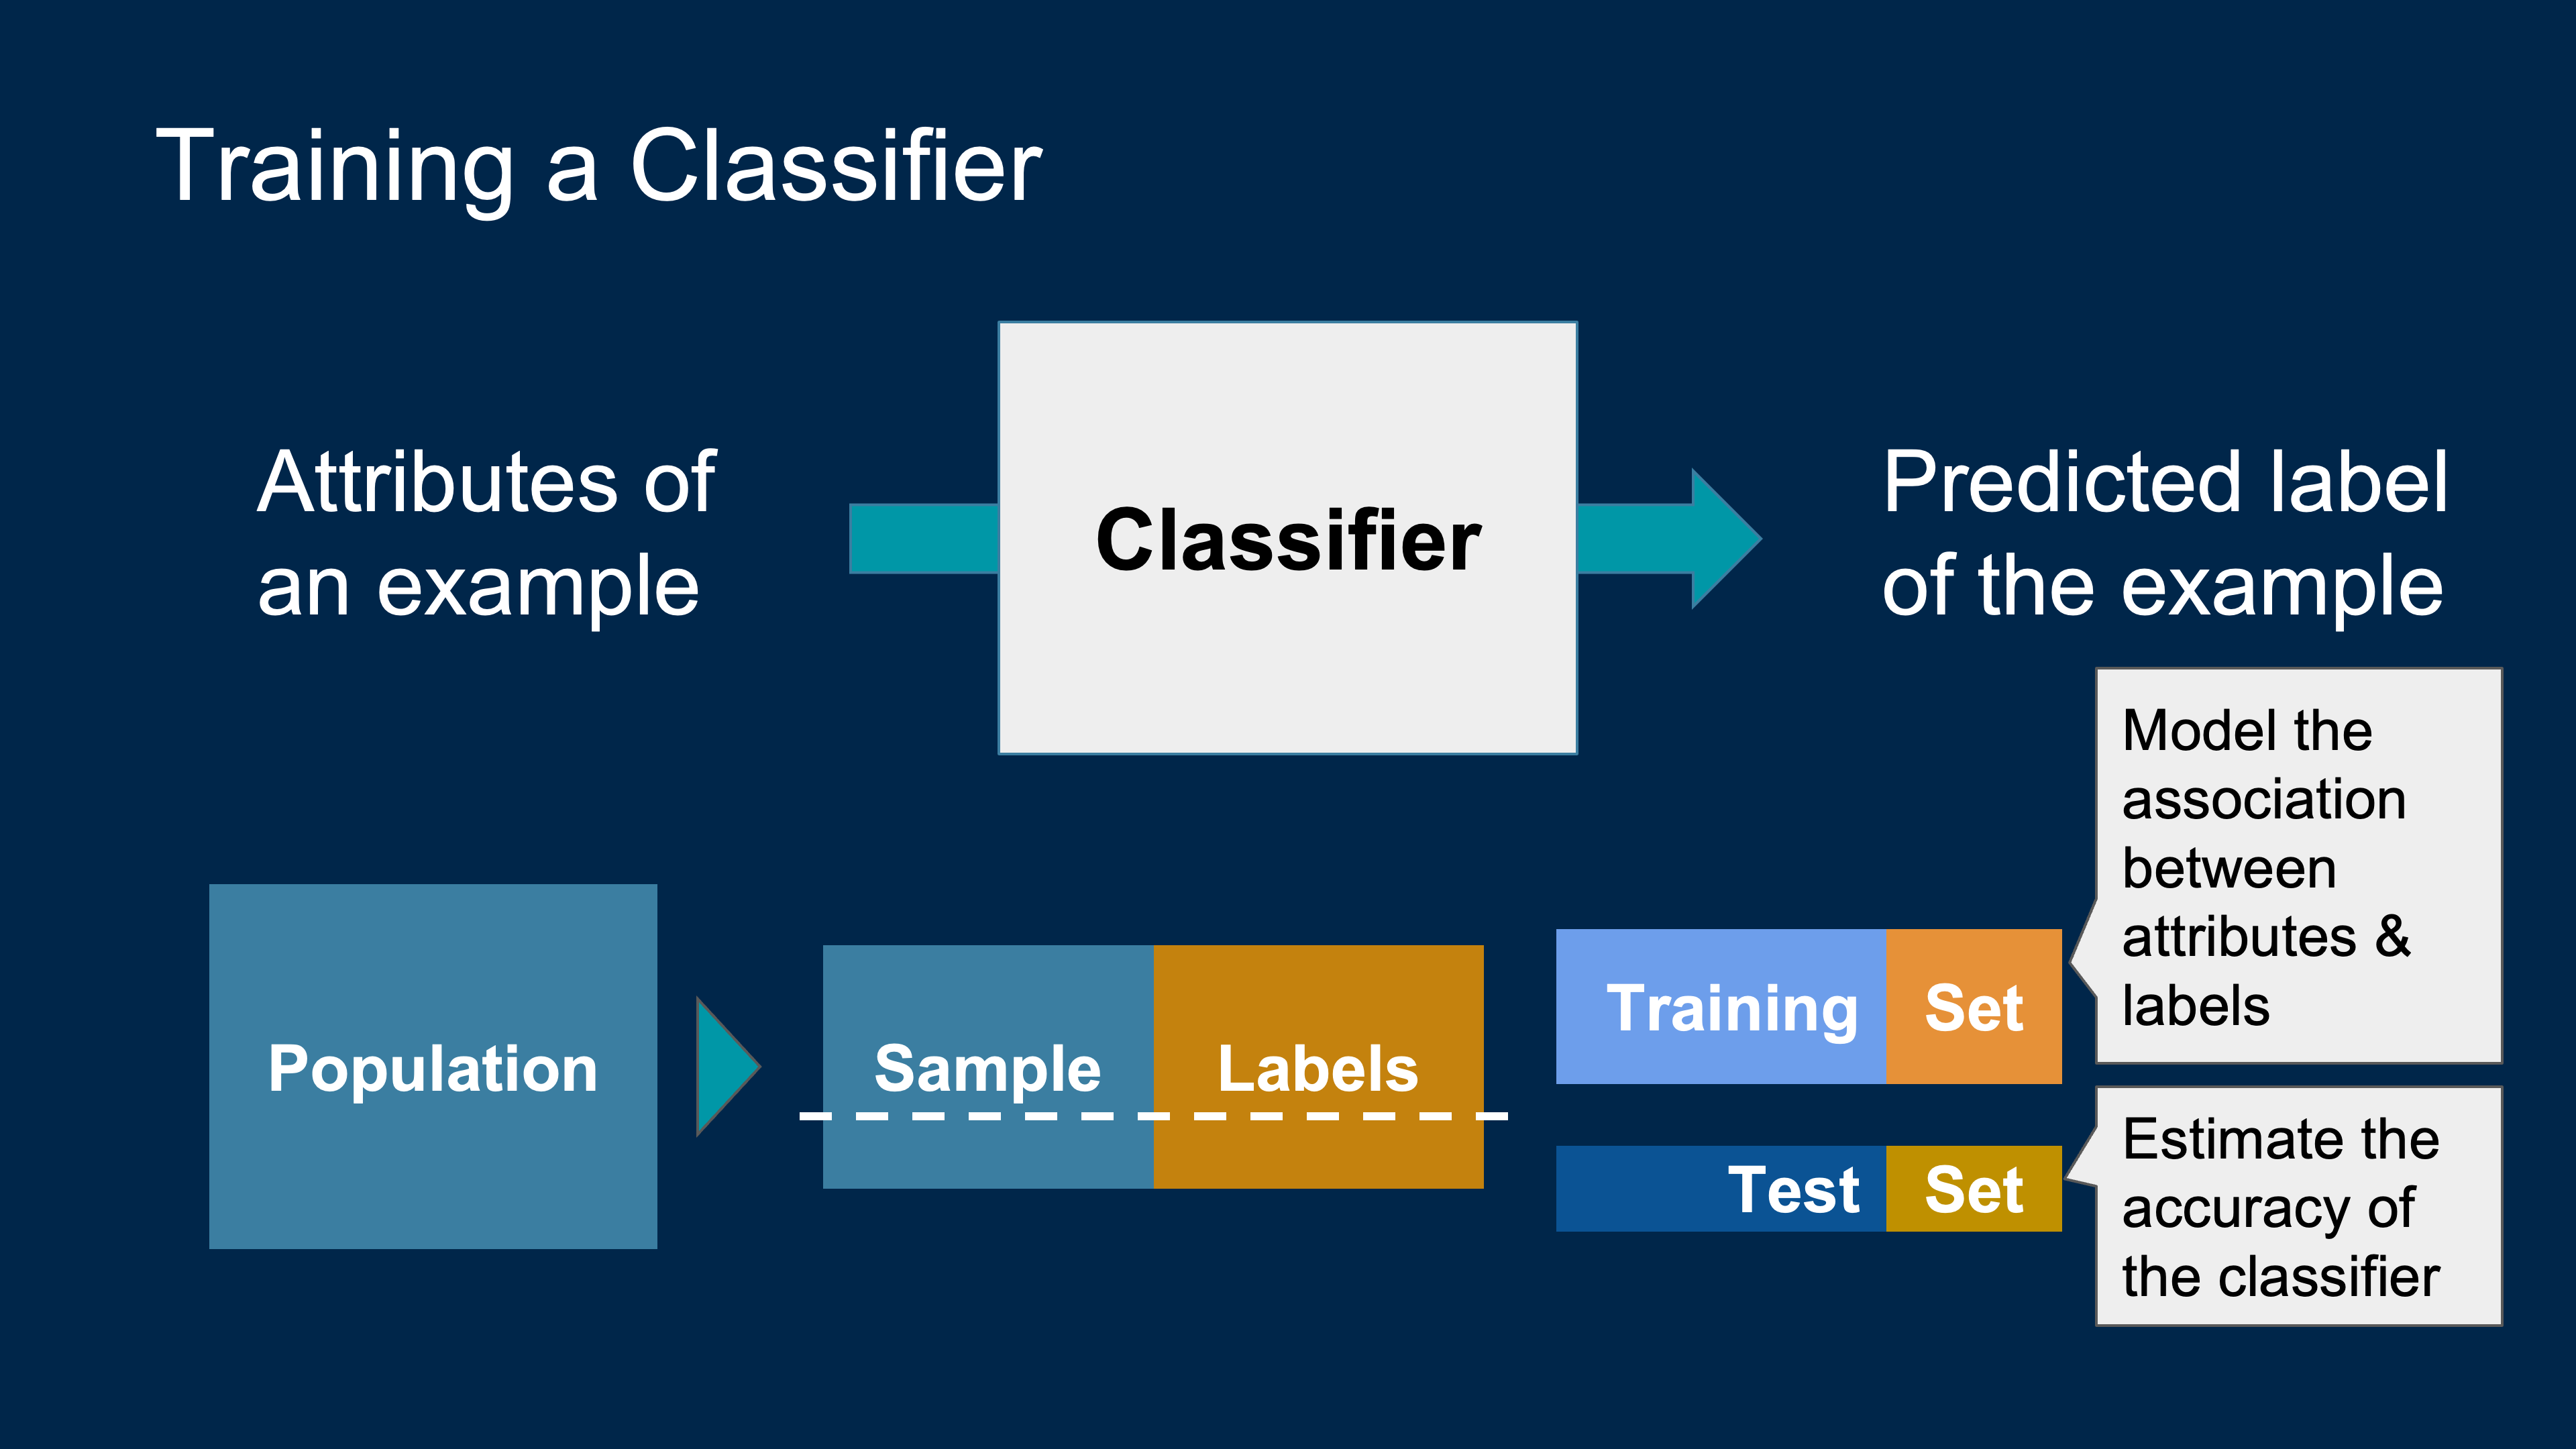
Machine Learning Algorithm
- A mathematical model
- calculated based on sample data
- that makes predictions or decisions without being explicitly programmed to perform the task
Classification Examples: Text
![]()
Output: (Spam, Not Spam)
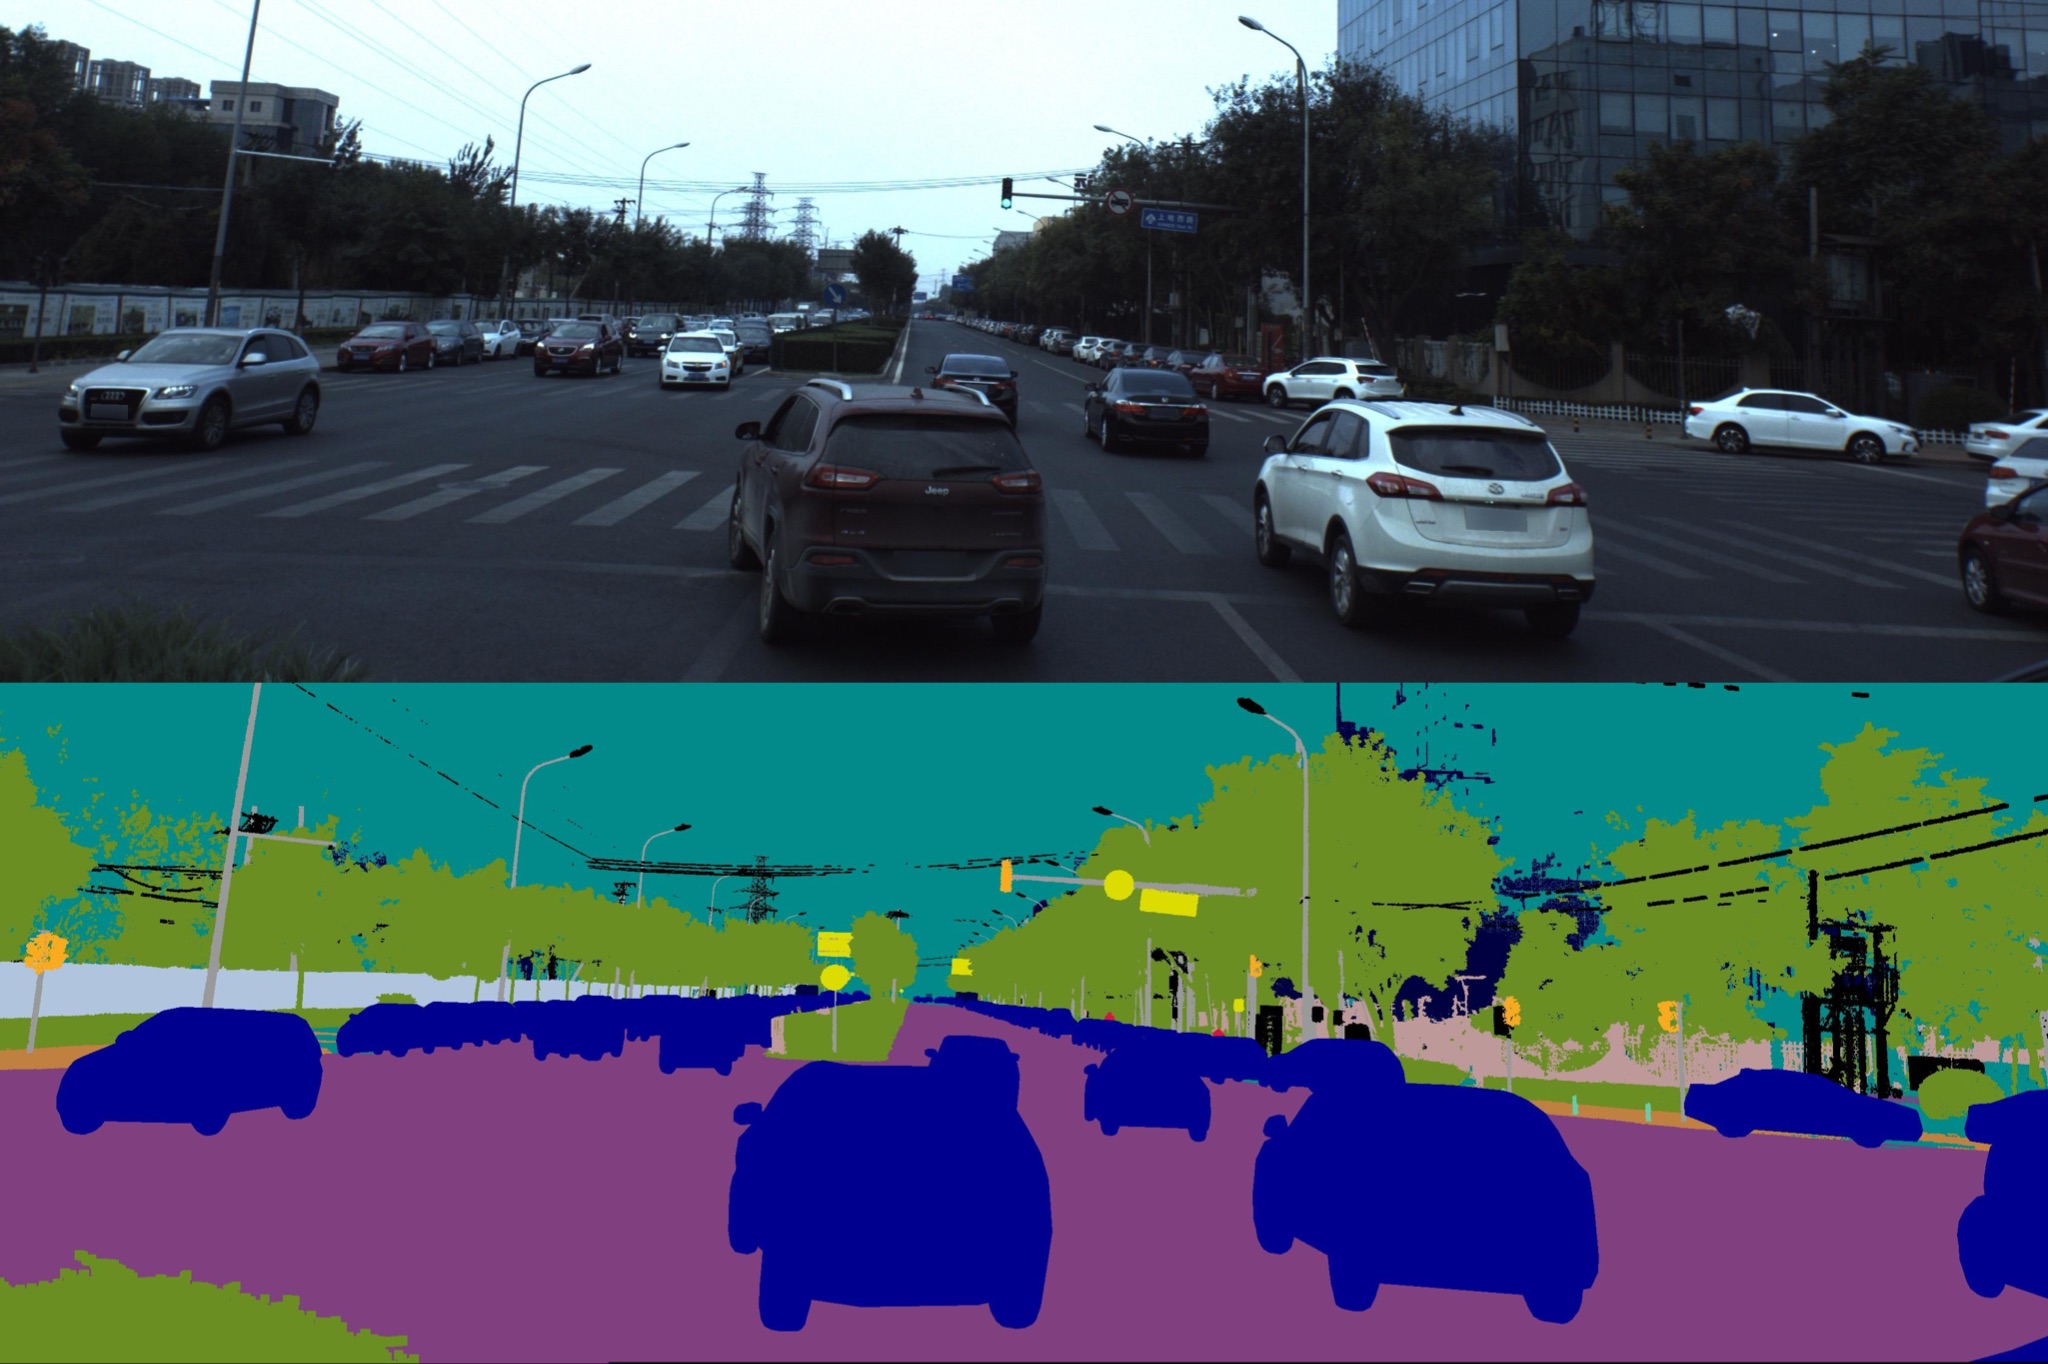
Classification Examples: Image
![]()
Output: (Car, Road, Tree, Sky, Traffic Sign)
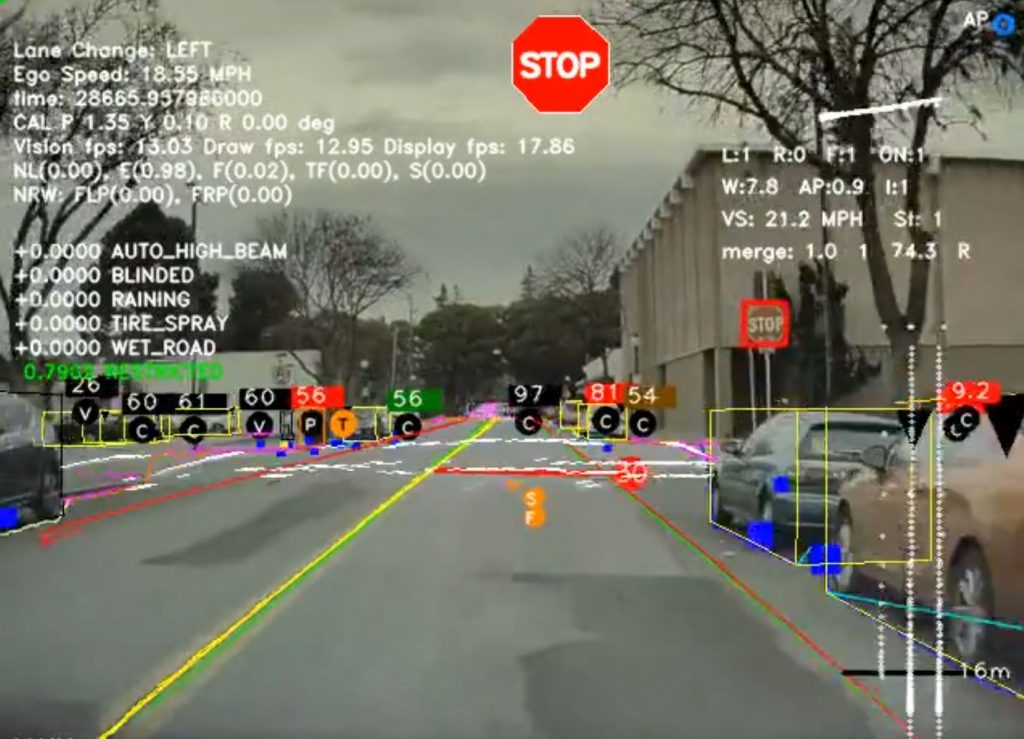
Classification Examples: Image
![]()
Output: (Car, Road, Tree, Sky, Traffic Sign)
Classification Examples: Videos
![]()
Output: (In, Out)
CKD Data
library(readr)
library(dplyr)
ckd <- read_csv("data/ckd.csv") |>
  rename(Glucose = `Blood Glucose Random`) |>
  mutate(
    Class = factor(
      Class,
      levels = c(0, 1),
      labels = c("No CKD", "CKD")
    )
  )

ckd |> count(Class)
# A tibble: 2 × 2
  Class      n
  <fct>  <int>
1 No CKD   115
2 CKD       43
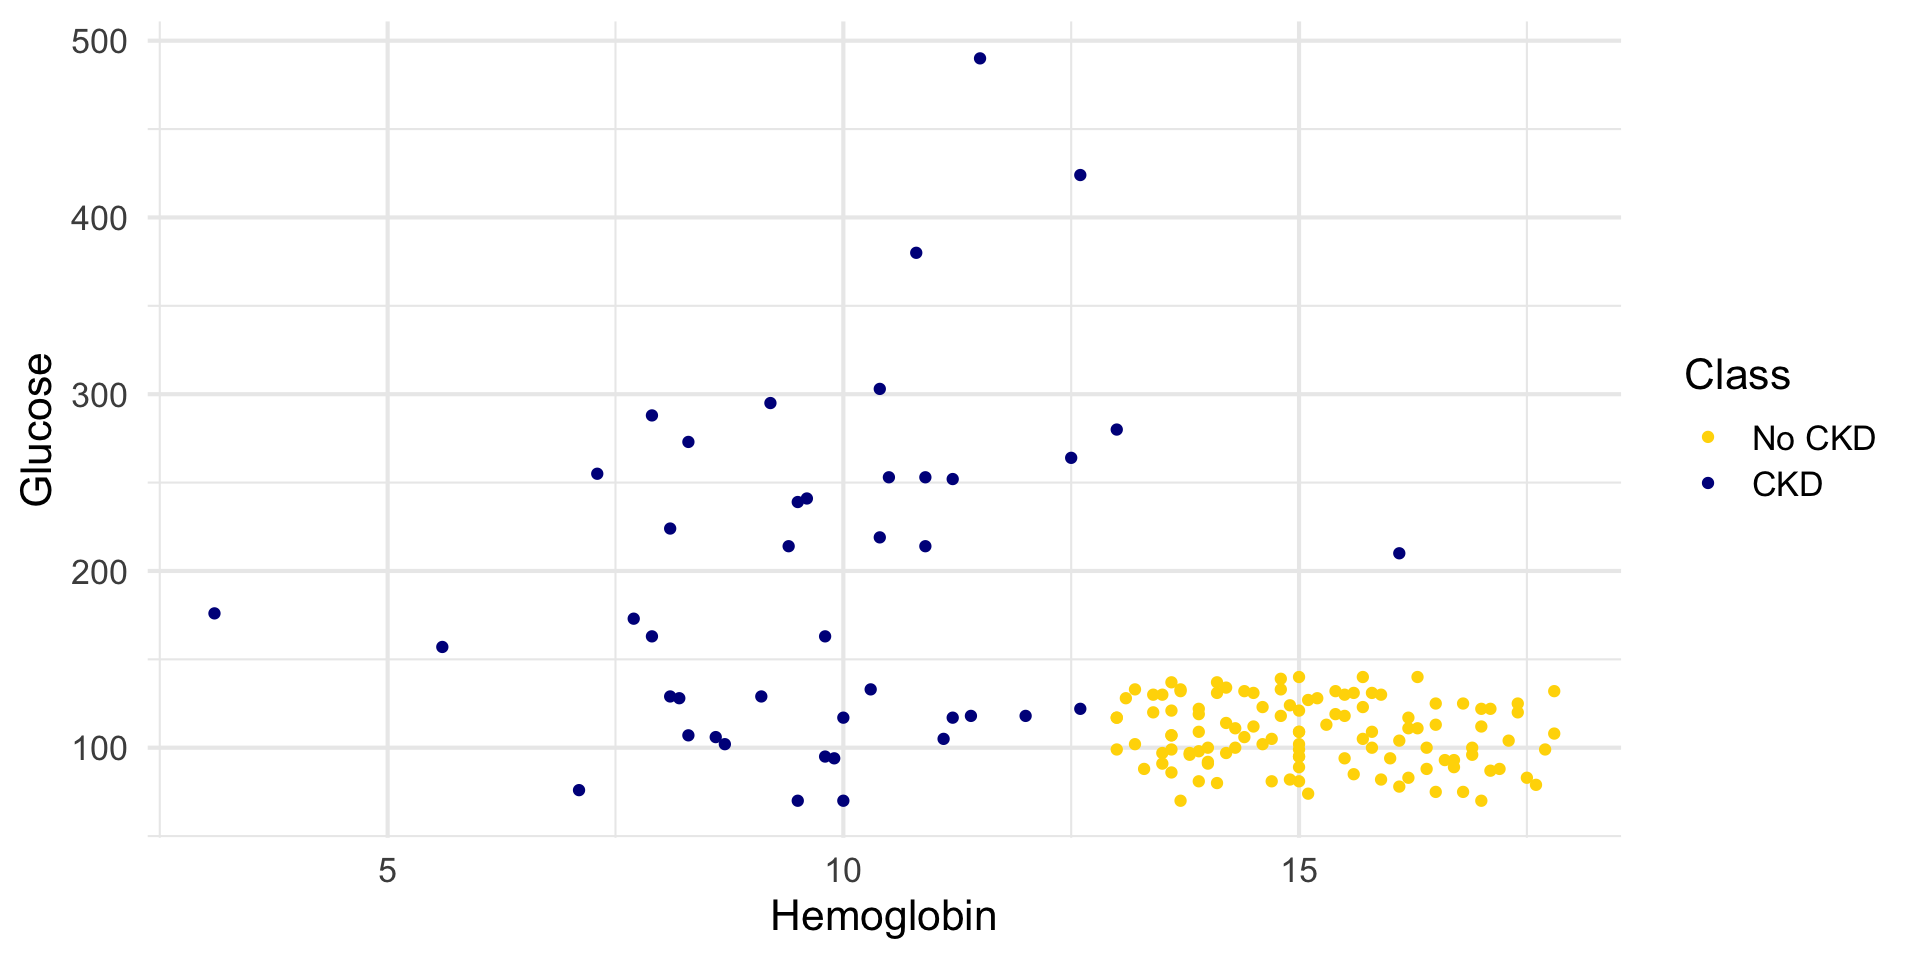
Hemoglobin and Glucose
library(ggplot2)

ggplot(ckd, aes(x = Hemoglobin, y = Glucose, color = Class)) +
  geom_point() +
  scale_color_manual(
    values = c("No CKD" = "gold", "CKD" = "darkblue")
  ) +
  theme_minimal(base_size = 16)
![]()
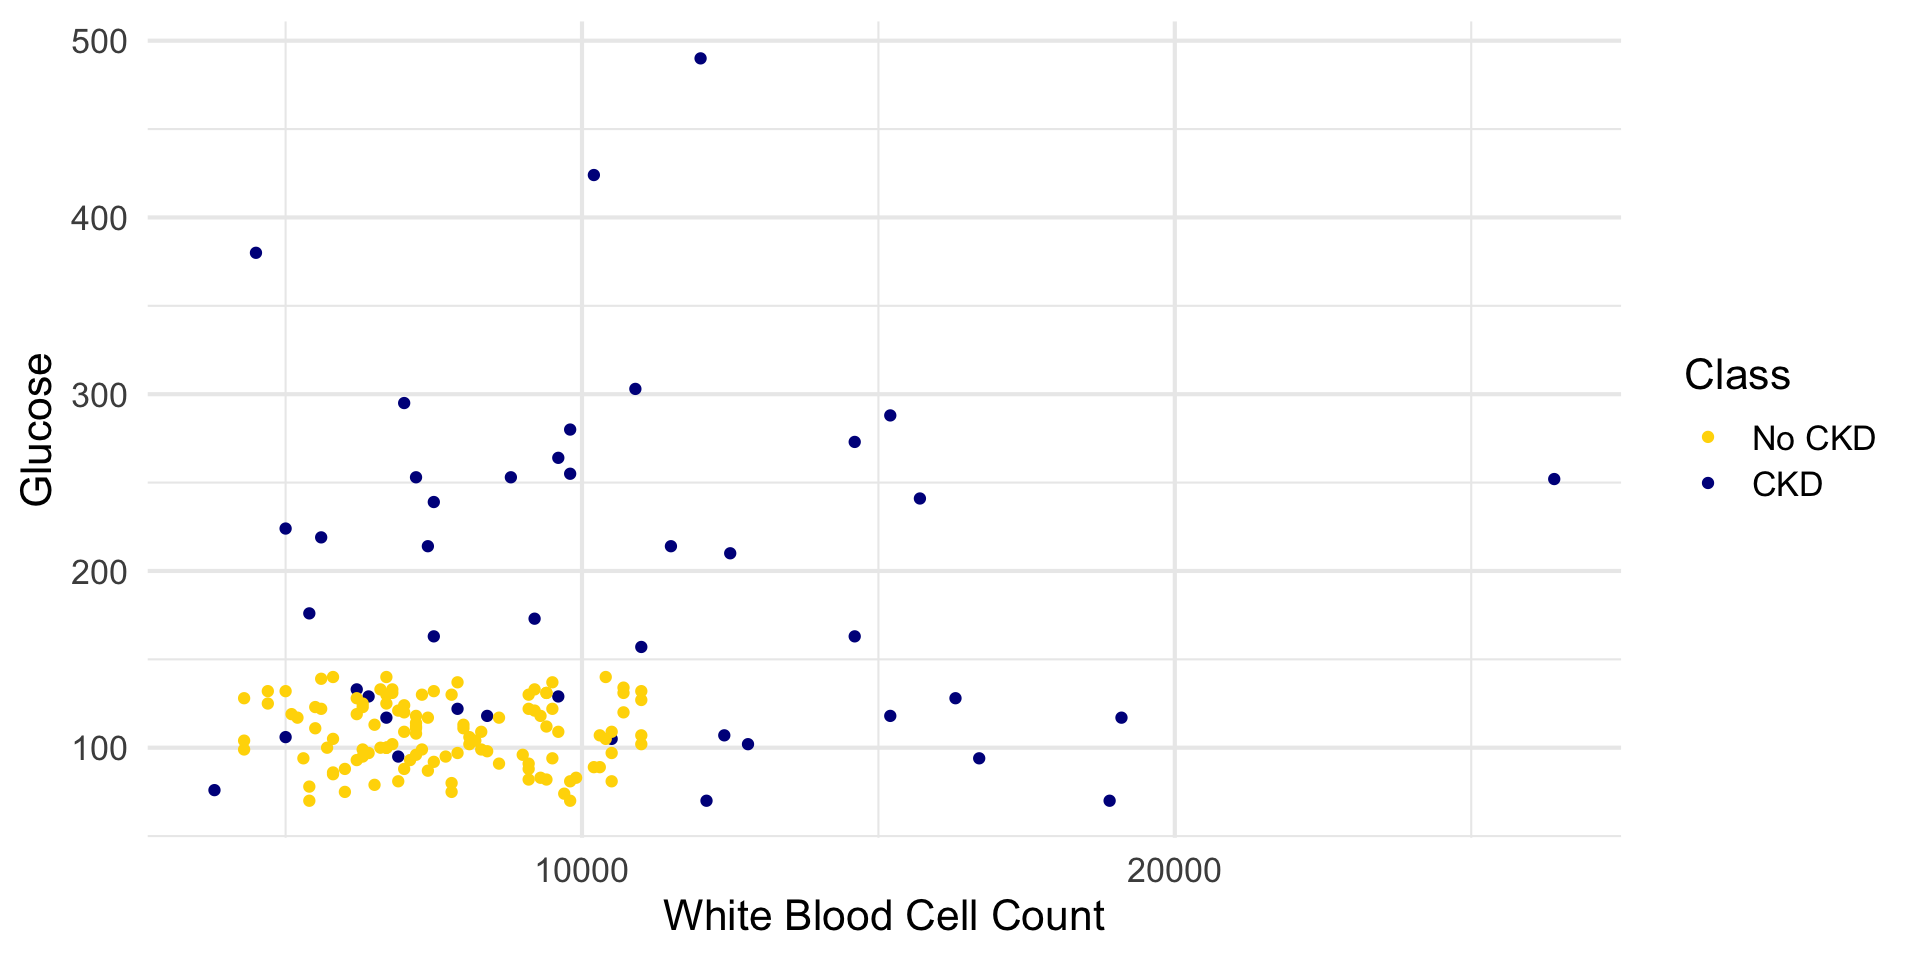
White Blood Cell Count and Glucose
ggplot(ckd, aes(x = `White Blood Cell Count`, y = Glucose, color = Class)) +
  geom_point() +
  scale_color_manual(
    values = c("No CKD" = "gold", "CKD" = "darkblue")
  ) +
  theme_minimal(base_size = 16)
![]()
Manual Classfier
max_gluc_0 <- ckd |>
  filter(Class == "No CKD") |>
  summarize(max_glucose = max(Glucose)) |>
  pull(max_glucose)

min_hemo_0 <- ckd |>
  filter(Class == "No CKD") |>
  summarize(min_hemo = min(Hemoglobin)) |>
  pull(min_hemo)

max_gluc_0
Manual Classfier
classify_manually <- function(hemoglobin, glucose) {
  if (hemoglobin < min_hemo_0 || glucose > max_gluc_0) {
    return(1)
  } else {
    return(0)
  }
}

classify_manually(15, 100)
classify_manually(10, 300)
Regression vs Classification (Summary)
- Regression:
- Output: numeric \(Y\) (e.g., income, temperature, score).
- Model: usually a line or curve.
- Fit by minimizing squared errors.
- Classification:
- Output: category (e.g., spam / not spam).
- Model: decision boundary between classes.
- Fit by minimizing classification errors (or related loss).