What is tidy data?
Sarah Cassie Burnett
September 16, 2025
Preliminaries
Where Does Data Come From?
- Your boss or a client sends you a file
- Survey data collected by you or someone else
- You can download it from a website
- You can scrape it from a website
- A data package (e.g.
unvotes) - You can access it through an API
Getting Started with Data
- Tabular data is data that is organized into rows and columns
- a.k.a. rectangular data
- A data frame is a special kind of tabular data used in data science
- A variable is something you can measure
- An observation is a single unit or case in your data set
- The unit of analysis is the level at which you are measuring
- In a cross-section: country, state, county, city, individual, etc.
- In a time-series: year, month, day, etc.
Adjectives for Your Data
The Concept of “Tidy Data”
Tidy data is data that can use the packages of the tidyverse
There are four basic principles to a tidy API:
- Reuse existing data structures.
- Compose simple functions with the pipe.
- Embrace functional programming.
- Design for humans.
The Concept of “Tidy Data”
- Each column represents a single variable
- Each row represents a single observation
- Each cell represents a single value
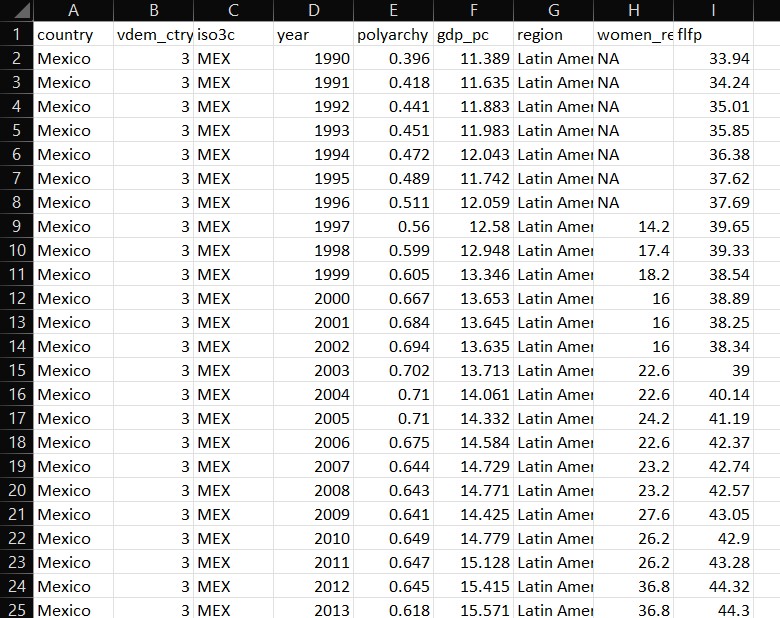
Tidy Data Example
What are Clean Data?
- Column names are easy to work with and are not duplicated
- Missing values have been dealt with
- There are no repeated observations or columns
- There are no blank observations or columns
- The data are in the proper format, for example dates should be formatted as dates
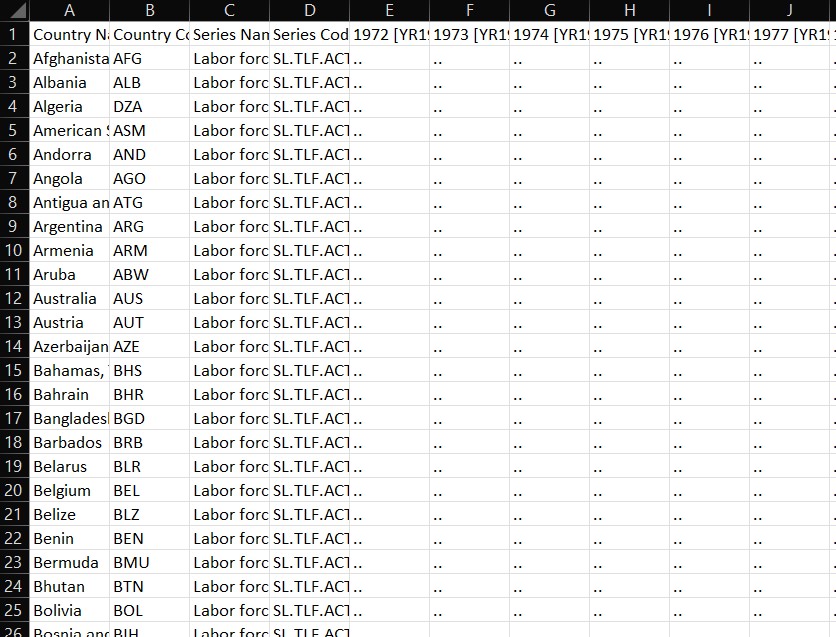
Messy Data Example
Which of These is Likely Tidy/Clean?
- Your boss or a client sends you a file
- Survey data collected by you or someone else
- You can download it from a website
- You can scrape it from a website
- A curated collection (e.g.
unvotes) - You can access it through an API
How Do We Get Tidy/Clean Data?
- Get lucky and find it
- Wrangle it ourselves
- Use a package where it has been wrangled for us
- Download via an API
Reading Data
Read Data into R
- Use
read_csv()function fromreadrpackage readrpackage is part of thetidyverse- Can do more with it than base R functions
R Code Review
<-is the assignment operator- Use it to assign values to objects
#is the comment operator- Use it to comment out code or add comments
- Different function than in markdown text
- To call a library, use
library()and name of library- name of library does not have to be in quotes, e.g.
library(readr) - only when you install it, e.g.
install.packages("readr")
- name of library does not have to be in quotes, e.g.
Read Data into R
Viewing the Data in R
Use glimpse() to see the columns and data types:
# load libraries
library(readr)
library(dplyr)

films <- read_csv("data/film_cleanish.csv")

glimpse(films)
Rows: 1,659
Columns: 9
$ Year <dbl> 1990, 1991, 1983, 1979, 1978, 1983, 1984, 1989, 1985, 199…
$ Length <dbl> 111, 113, 104, 122, 94, 140, 101, 99, 104, 149, 188, 117,…
$ Title <chr> "Tie Me Up! Tie Me Down!", "High Heels", "Dead Zone, The"…
$ Genre <chr> "Comedy", "Comedy", "Horror", "Action", "Drama", "Action"…
$ `Lead Man` <chr> "Banderas, Antonio", "Bosé, Miguel", "Walken, Christopher…
$ `Lead Woman` <chr> "Abril, Victoria", "Abril, Victoria", "Adams, Brooke", "A…
$ Director <chr> "Almodóvar, Pedro", "Almodóvar, Pedro", "Cronenberg, Davi…
$ Popularity <dbl> 68, 68, 79, 6, 14, 68, 14, 28, 6, 32, 81, 17, 46, 49, 6, …
$ Awards <lgl> FALSE, FALSE, FALSE, FALSE, FALSE, FALSE, FALSE, FALSE, F…Or use View() or click on the name of the object in your Environment tab to see the data in a spreadsheet:

Write a New CSV File
Now try writing the same data to a file with a different name
Excel Files
Read in Excel File
Google Sheets
Import Data from Google Sheets
- Can use
googlesheets4 - Have a look at these Gapminder data
- Use
gs4_deauth()to authenticate - Then use
read_sheet()to read in the data
Example Code
Or…
Or…
Try It Out!
- Use the code above to read in the data
- Try reading in Gapminder data for a different country
05:00
Find Your Own Data
- Visit kaggle.com
- Find a dataset you like
- Download it as a CSV
- Create an R project and put it in the directory
- Read it into R
- Explore with
glimpse()andView()
05:00