library(readr)
library(dplyr)
library(tidyr)
library(ggplot2)

# NOAA GHCN Monthly (local subset for speed)
# https://www.ncei.noaa.gov/products/land-based-station/global-historical-climatology-network-monthly
temps <- read_csv("temps.csv", show_col_types = FALSE) # or temps_small.csv if temps.csv is too big
# show_col_types = FALSE doesn't do much, just supresses the message read out
# This is good for the including code in the quarto documents


# Station metadata
# https://www.philchodrow.prof/
stations <- read_csv("https://raw.githubusercontent.com/PhilChodrow/PIC16B/master/datasets/noaa-ghcn/station-metadata.csv",
                     show_col_types = FALSE)

# FIPS 10-4 to ISO + Names
# https://www.mysociety.org/
countries <- read_csv("https://raw.githubusercontent.com/mysociety/gaze/master/data/fips-10-4-to-iso-country-codes.csv",
show_col_types = FALSE)Merging Data Frames
Sarah Cassie Burnett
September 25, 2025
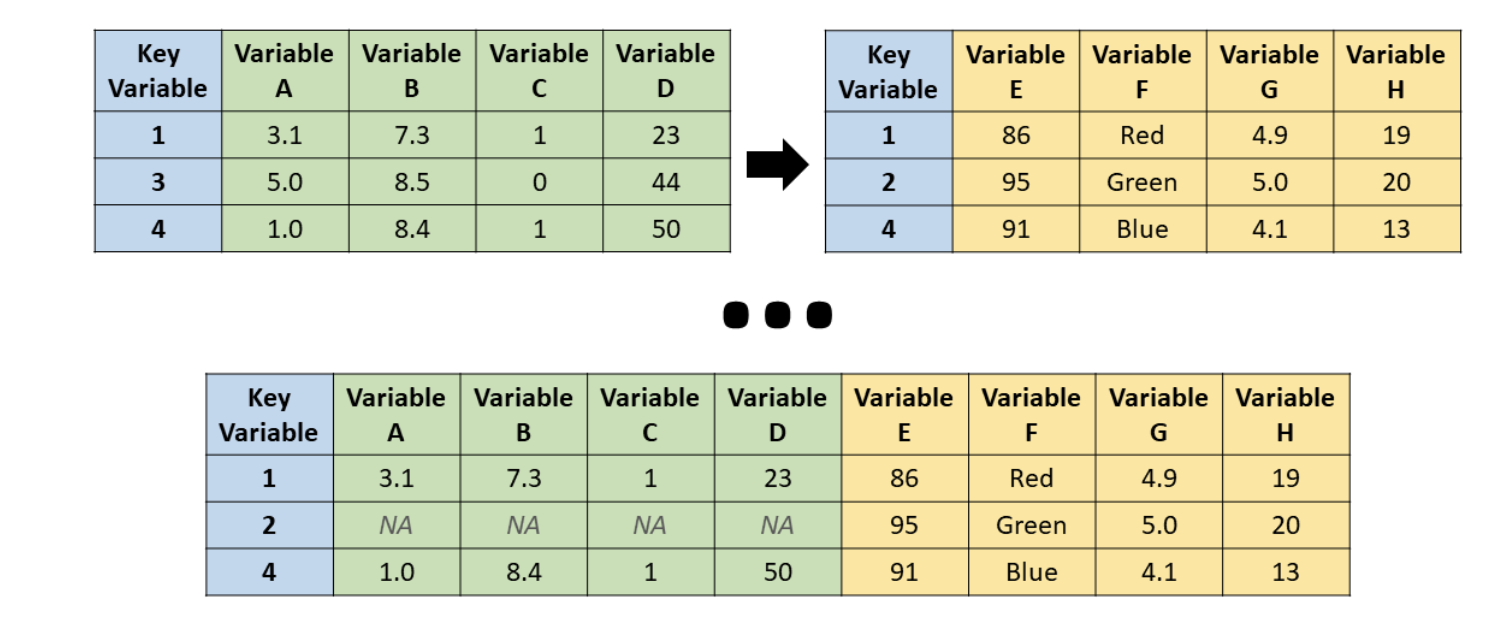
What is a Join
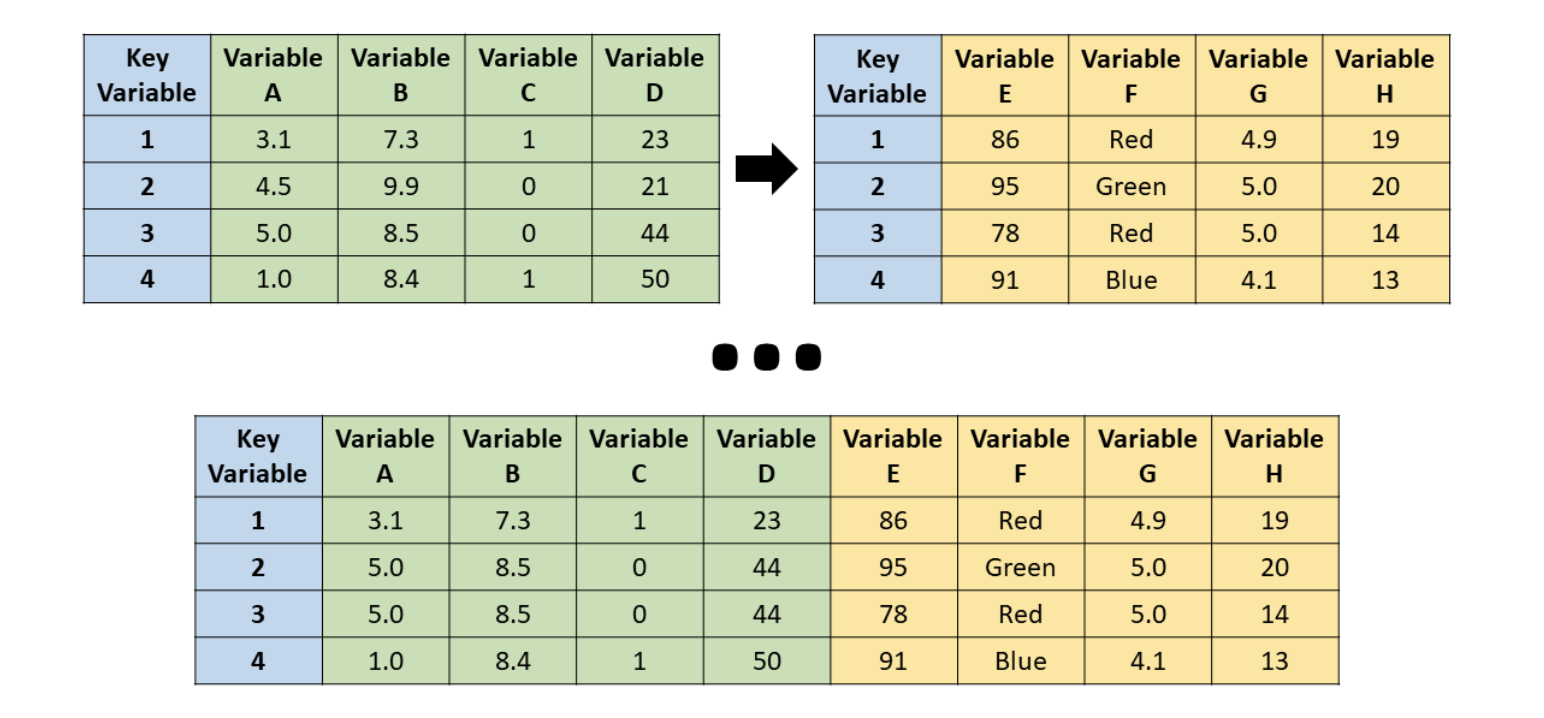
Horizontal Join (Merge)
- Often we have data from two different sources
- Results in two data frames
- How can we combine them into one?
Illustration
Source: R for HR
Types of Joins in dplyr
- Mutating versus filtering joins
- Four types of mutating joins
inner_join()full_join()left_join()right_join()
- For the most part we will use
left_join()
inner_join()
Source: R for HR
full_join()
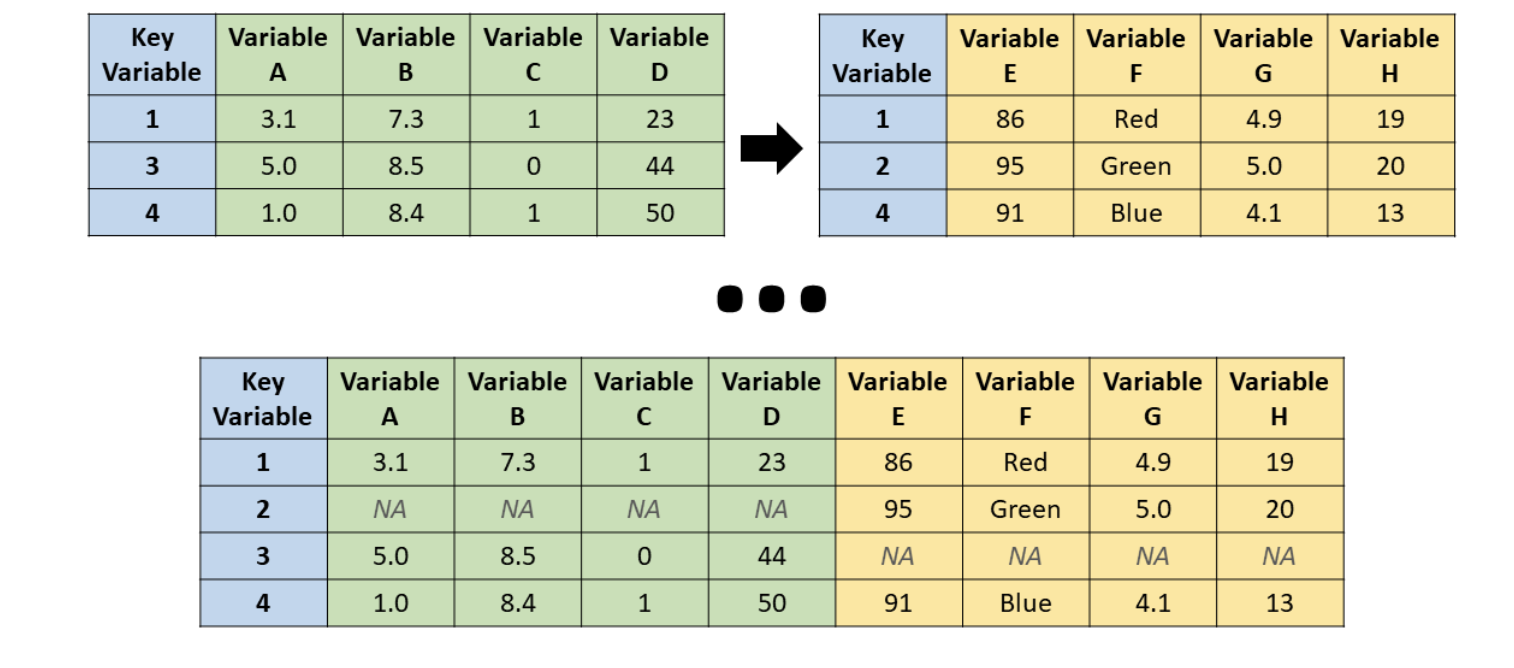
Source: R for HR
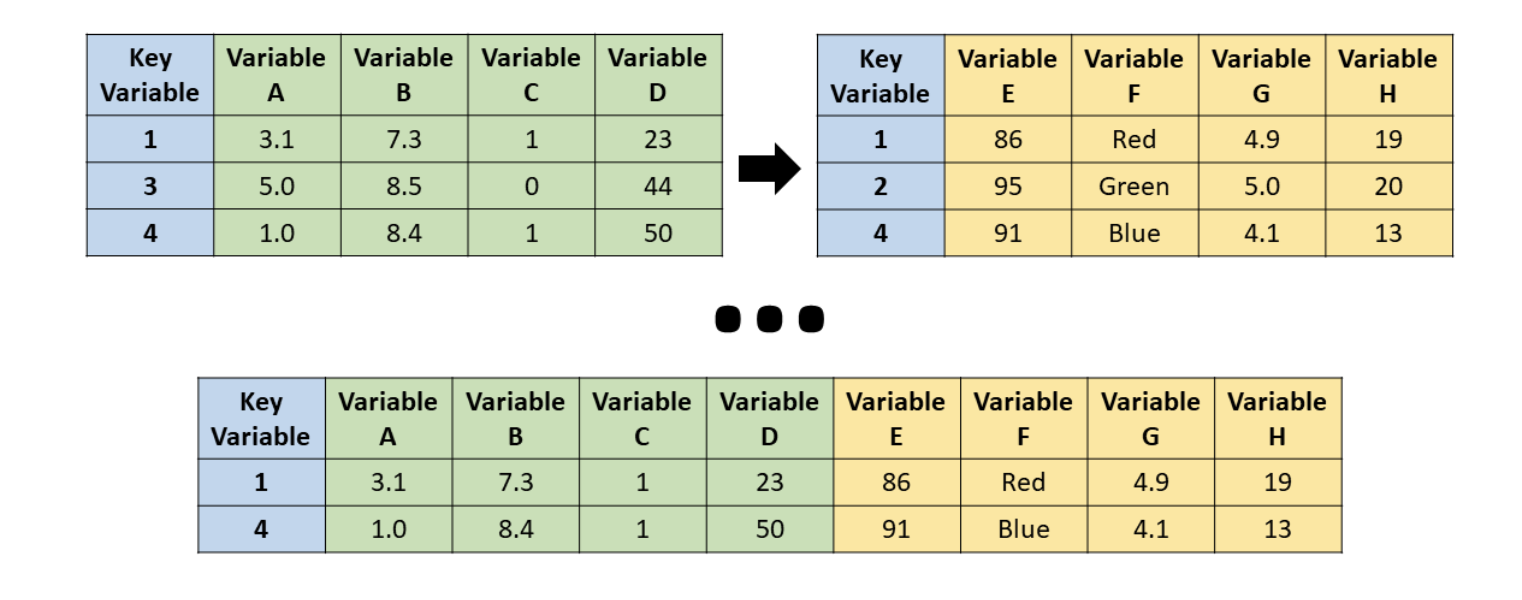
left_join()
Source: R for HR
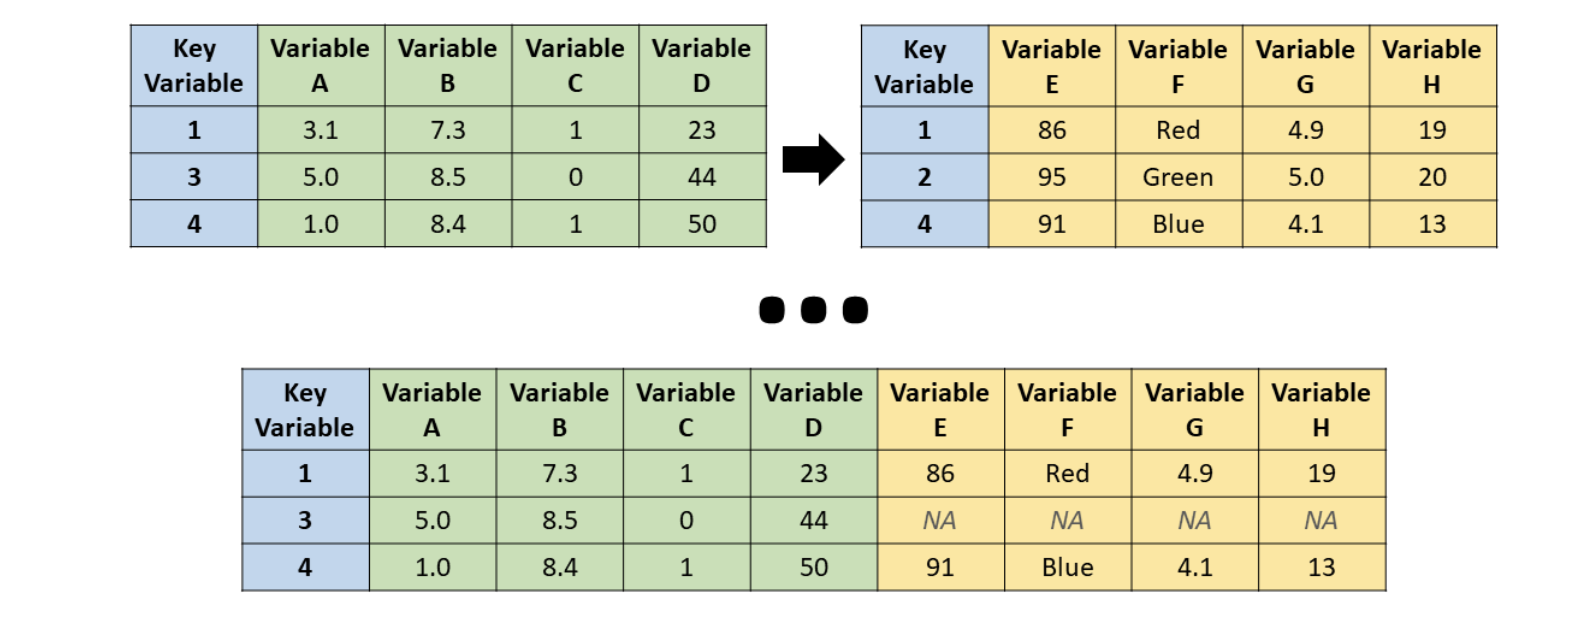
right_join()
Source: R for HR
Exercise
Scenario 1: NOAA weather station data
Load Libraries and data
03:00
Check out the data
Try it out!
Write the wrangling code to get the temperatures at each person’s birth month and year.
Try adding the names of the month as labels instead of numbers.
After you finish, take a look at the column names and values to see if there are any variables you could potential use as a key.
03:00
Remove duplicates from country dataset
Join Plan
1. Keys
- Do they match between tables?
temps.IDandstations.ID
substr(ID, 1, 2)andcountries."FIPS 10-4"
2. Join Type
- What rows do we want to keep?
- Keep all rows from
temps
- Use left joins
- Keep all rows from
Join: temps + stations
Create FIPS from ID
Join: add countries
Clean data from missing values and reorder
Plot: Temperature Over Time
Save Plot
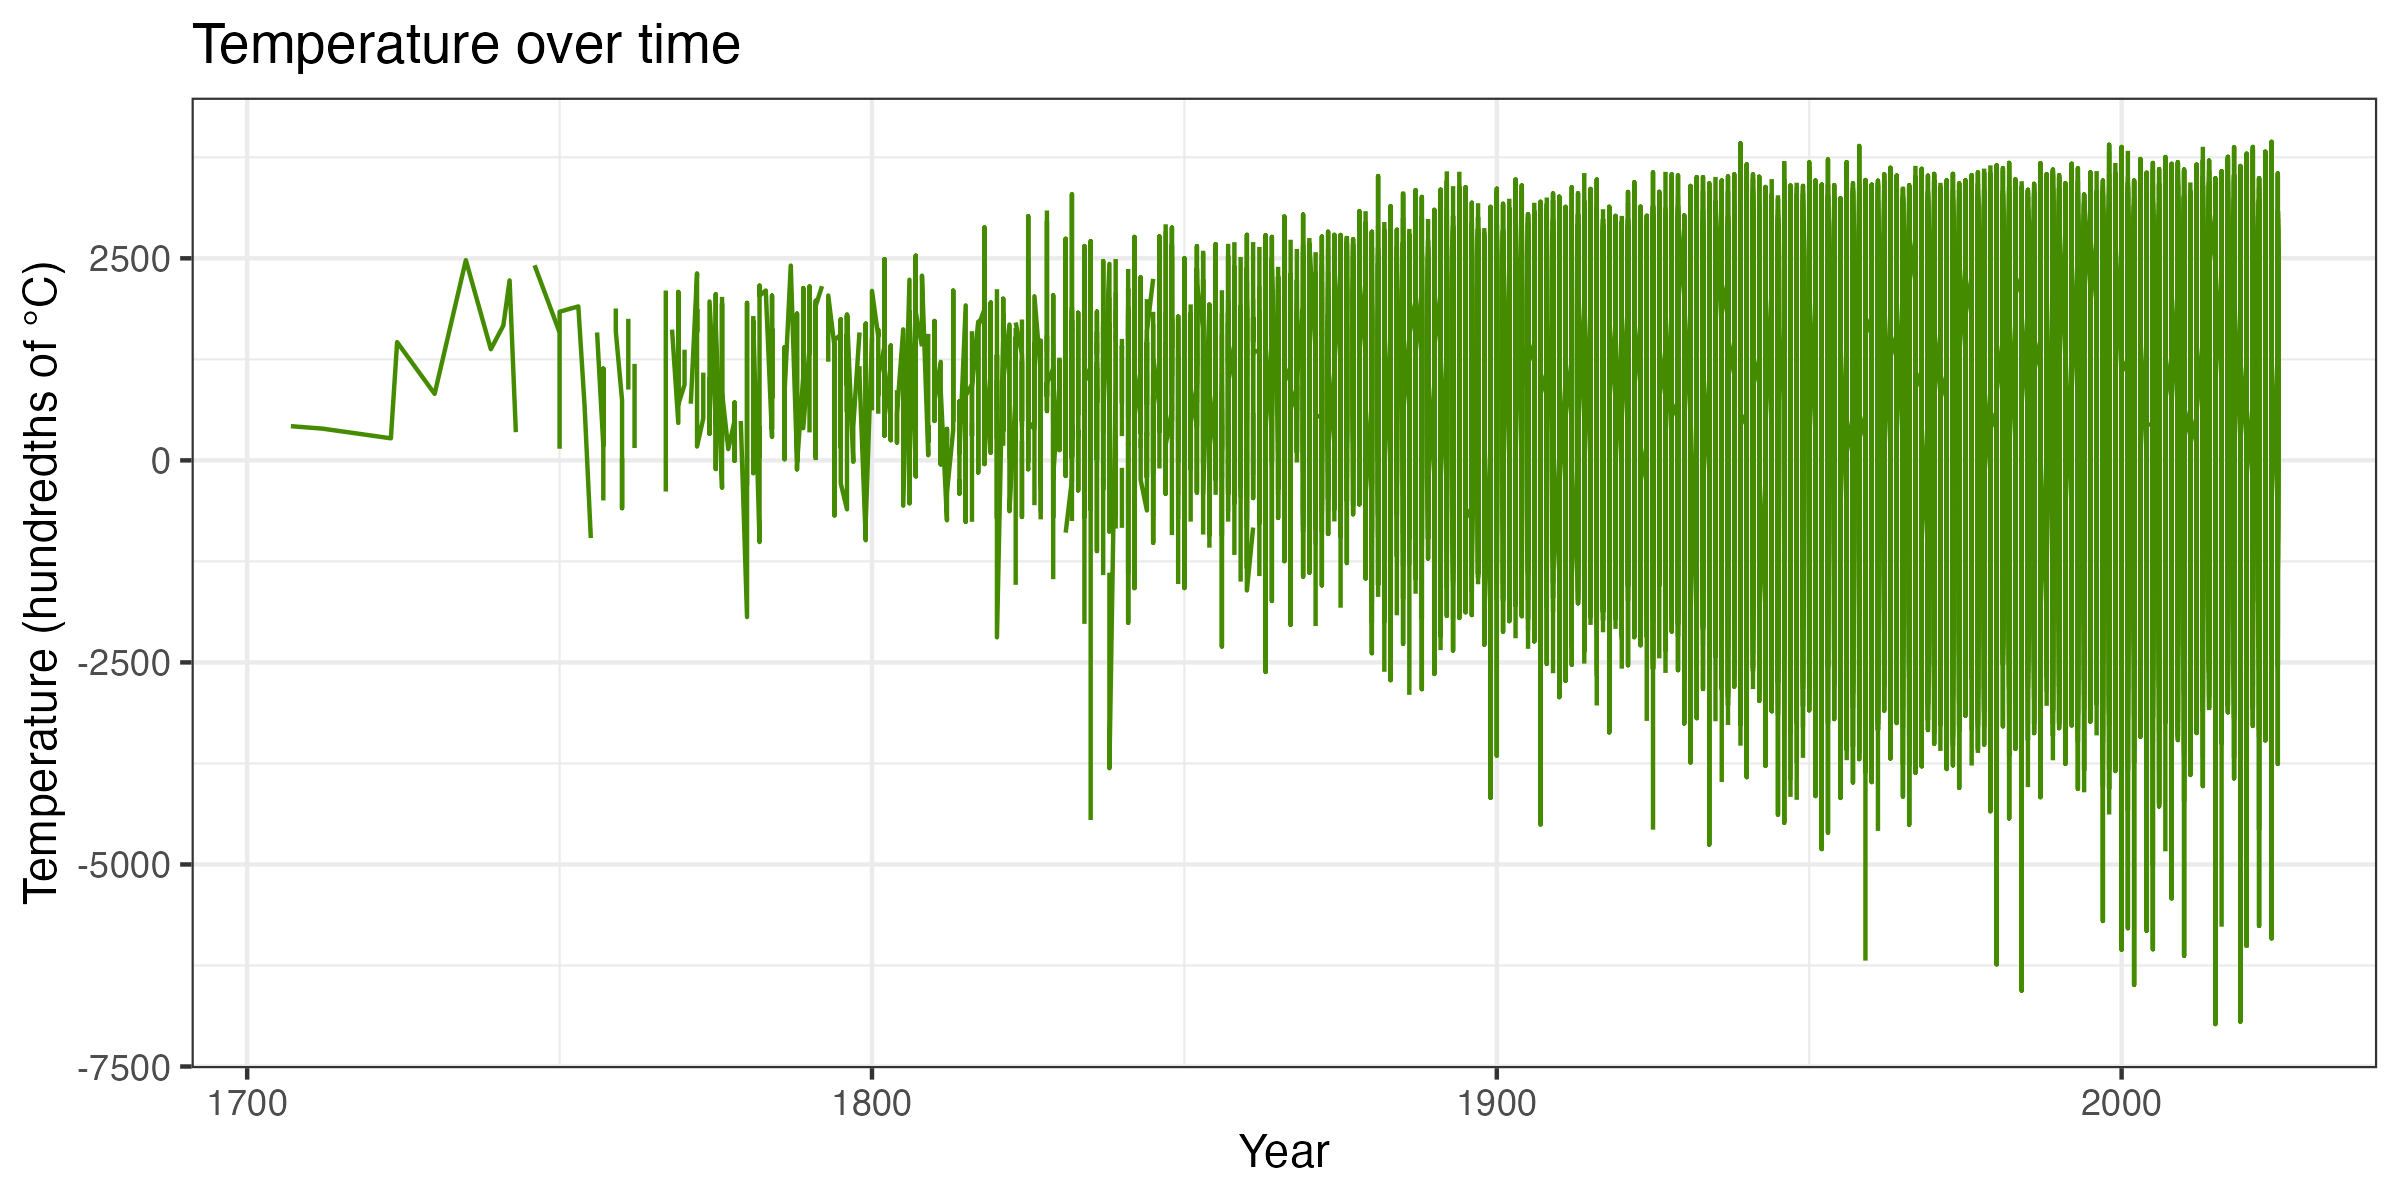
Temperature over time across the world
Scenario 2: Merge World Bank and V-Dem
- We want to merge two data frames
- One is from the World Bank
- The other is from V-Dem
- How do we do it?
Grab Some WB Data
# Load packages
library(wbstats)
library(dplyr)
library(janitor)

# Store the list of indicators in an object
indicators <- c("flfp" = "SL.TLF.CACT.FE.ZS", "women_rep" = "SG.GEN.PARL.ZS")

# Download the data
wb_dta <- wb_data(indicators, mrv = 25) |> # most recent 25 years
  select(!iso2c) |>
  rename(year = date) |>
  mutate(
    flfp = round_to_fraction(flfp, denominator = 100), # round to nearest 100th
    women_rep = round_to_fraction(women_rep, denominator = 100)
  )

# View the data
glimpse(wb_dta)
Grab Some V-Dem Data
library(vdemlite)

vdem_dta <- fetchdem(indicators = c("v2x_gender", "v2x_gencl", "e_regionpol_6C") |>
                         start_year = 2000, end_year = 2020) |> # 20 year span
                 rename(
                   women_polemp = v2x_gender,
                   women_civlib = v2x_gencl,
                   region = e_regionpol_6C
                 ) |>
            mutate(
              region = case_match(region,
                                  1 ~ "Eastern Europe",
                                  2 ~ "Latin America",
                                  3 ~ "Middle East",
                                  4 ~ "Africa",
                                  5 ~ "The West",
                                  6 ~ "Asia")
              )

glimpse(vdem_dta)
Key Questions
- What is the unit of analysis?
- What is/are the corresponding identifier variables?
- Are the identifier variables in common?
- Or do they have to be added/transformed to match?
Merging WB and V-Dem Data
- These are both time-series, country-level data
- Need to merge by country-year
- Year is easy
- But there are many different country codes
- Can use
countrycodepackage to assign country codes
Use countrycode
# Load countrycode
library(countrycode)

# Create new iso3c variable
vdem_data <- vdem_data |>
  mutate(iso3c = countrycode(sourcevar = country_id, # what we are converting
        origin = "vdem",         # we are converting from vdem
        destination = "wb"))  |> # and converting to the WB iso3c code
  relocate(iso3c, .after = country_id) # move iso3c

# View the data
glimpse(dem_data)
Try it Yourself
- Using your democracy data frame from the last lesson
- Use
mutate()andcountrycode()to add iso3c country codes - Use
relocateto move your iso3c code to the “front” of your data frame (optional)
Use left_join() to Merge
Try it Yourself
- Take your V-Dem data frame and your World Bank data frame
- Using
left_join()to merge on country code and year - Along the way, use
rename()andselect()to insure you have just one country name - Try
inner_join(),full_join(), andright_join()as time allows
Summarize the Data
- Do a group, summarize, arrange sequence on your merged data frame
- Group and summarize by country (mean or median)
- Try using
across()to summarize multiple columns at once
Create a Scatter Plot
- Now you have one data point per country
- Use
ggplot2to create a scatter plot