library(readr)
library(dplyr)
library(tidyr)
library(ggplot2)
# NOAA GHCN Monthly (local subset for speed)
# https://www.ncei.noaa.gov/products/land-based-station/global-historical-climatology-network-monthly
temps <- read_csv("temps.csv", show_col_types = FALSE)
# show_col_types = FALSE doesn't do much, just supresses the message read out
# This is good for the including code in the quarto documents


# Station metadata
# https://www.philchodrow.prof/
stations <- read_csv("https://raw.githubusercontent.com/PhilChodrow/PIC16B/master/datasets/noaa-ghcn/station-metadata.csv",
                     show_col_types = FALSE)

# FIPS 10-4 to ISO + Names
# https://www.mysociety.org/
countries <- read_csv("https://raw.githubusercontent.com/mysociety/gaze/master/data/fips-10-4-to-iso-country-codes.csv",
show_col_types = FALSE)Cleaning Data
Sarah Cassie Burnett
September 30, 2025
Scenario 1: NOAA weather station data
Load Libraries and data
02:00
Check out the data
Join Plan
1. Keys
- Do they match between tables?
temps.IDandstations.ID
substr(ID, 1, 2)andcountries."FIPS 10-4"
2. Join Type
- What rows do we want to keep?
- Keep all rows from
temps
- Use left joins
- Keep all rows from
Join: temps + stations
Create FIPS from ID
Join: add countries
Issues from duplicate FIPS codes
Remove duplicates from country dataset
Clean up the names to remove whitespace
Clean data from missing values, filter, and reorder
mytemps <- temps %>%
  left_join(stations,  by = "ID") %>%
  # match country code: ID prefix matches FIPS 10-4 (first 2 chars of ID)?
  mutate(`FIPS 10-4` = substr(ID, 1, 2)) %>%
  left_join(countries, by = "FIPS 10-4") %>%
  mutate(
    Temp = na_if(Temp, -9999),   # turn -9999 into NA
  ) %>%
  filter(LATITUDE >= 40 | LATITUDE <= -40) %>%
  arrange(.by = desc(Year))

mytemps |> head(7)
mytemps |> tail(7)
Plot: Temperature Over Time
library(ggplot2)

# sample 1% for plotting, not always necessary
temps_small <- mytemps %>% sample_frac(0.01)


library(ggplot2)
# simple line plot
p <- ggplot(temps_small, aes(x = Year, y = Temp)) +
  geom_line(color = "chartreuse4") +
  labs(
    title = "Temperature over time",
    x = "Year",
    y = "Temperature (hundredths of °C)",
  ) +
  theme_bw()
Plot: Temperature Over Time
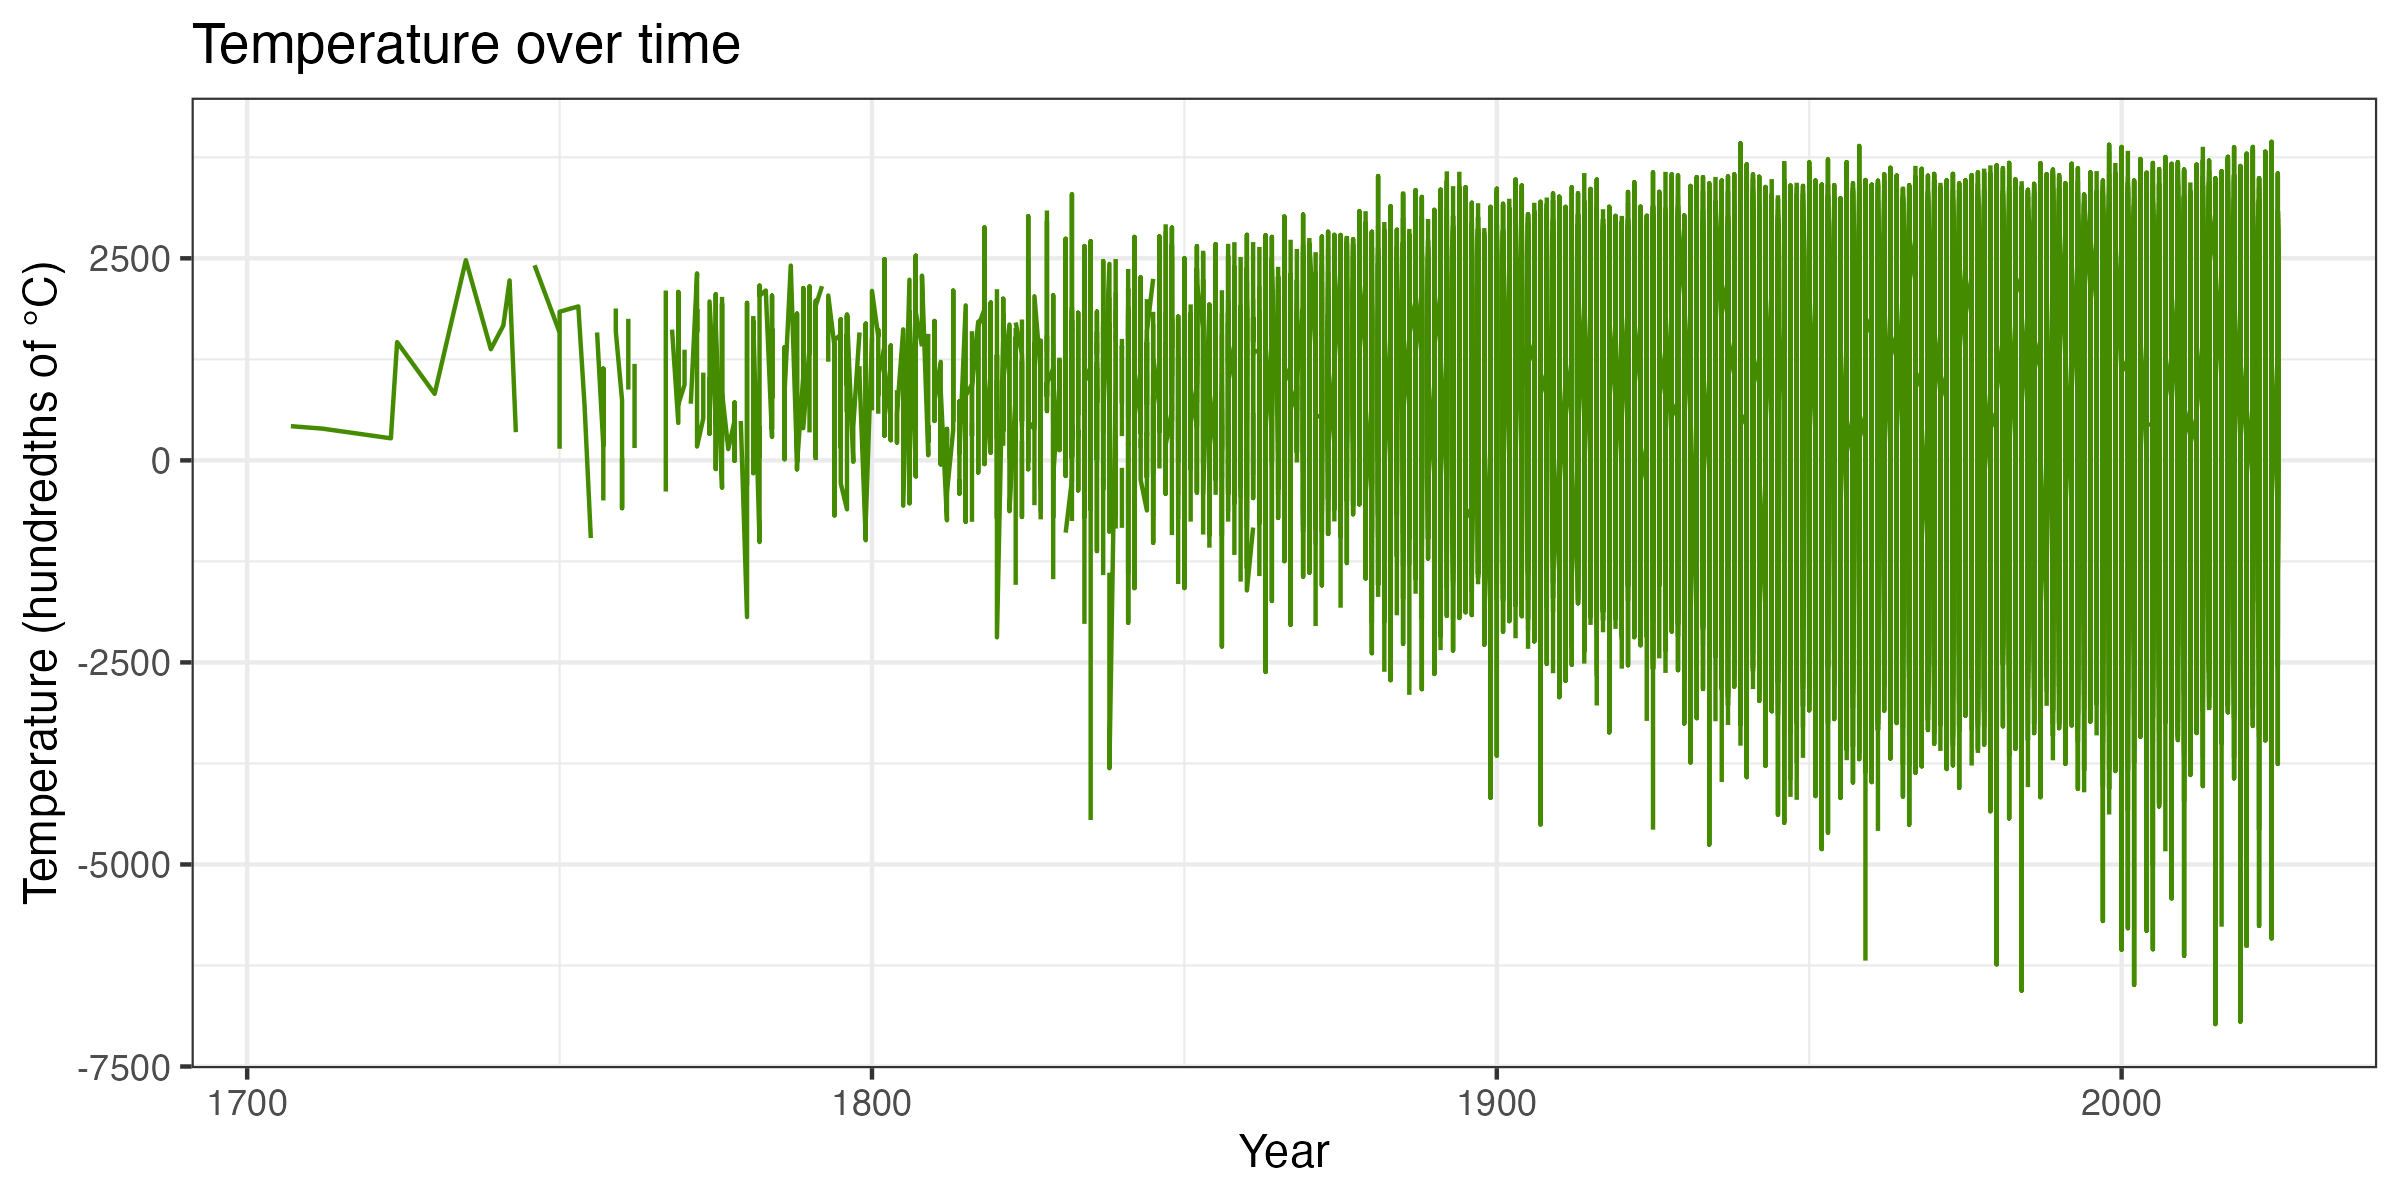
Temperatures at weather stations over time
Save Plot
Plot Temperature at the Locations of the Data
ggplot(temps_small, aes(x = LONGITUDE, y = LATITUDE, color = Temp/100)) +
  geom_point(alpha = 0.6, size = 1.2, na.rm = TRUE) +
  scale_color_viridis_c(option = "C", na.value = "grey80") +
  coord_quickmap() +
  labs(
    title = "Observed Temperature by Location",
    x = "Longitude", y = "Latitude",
    color = "Temp (°C)"
  ) +
  theme_bw()
Plot Temperature at the Locations of the Data
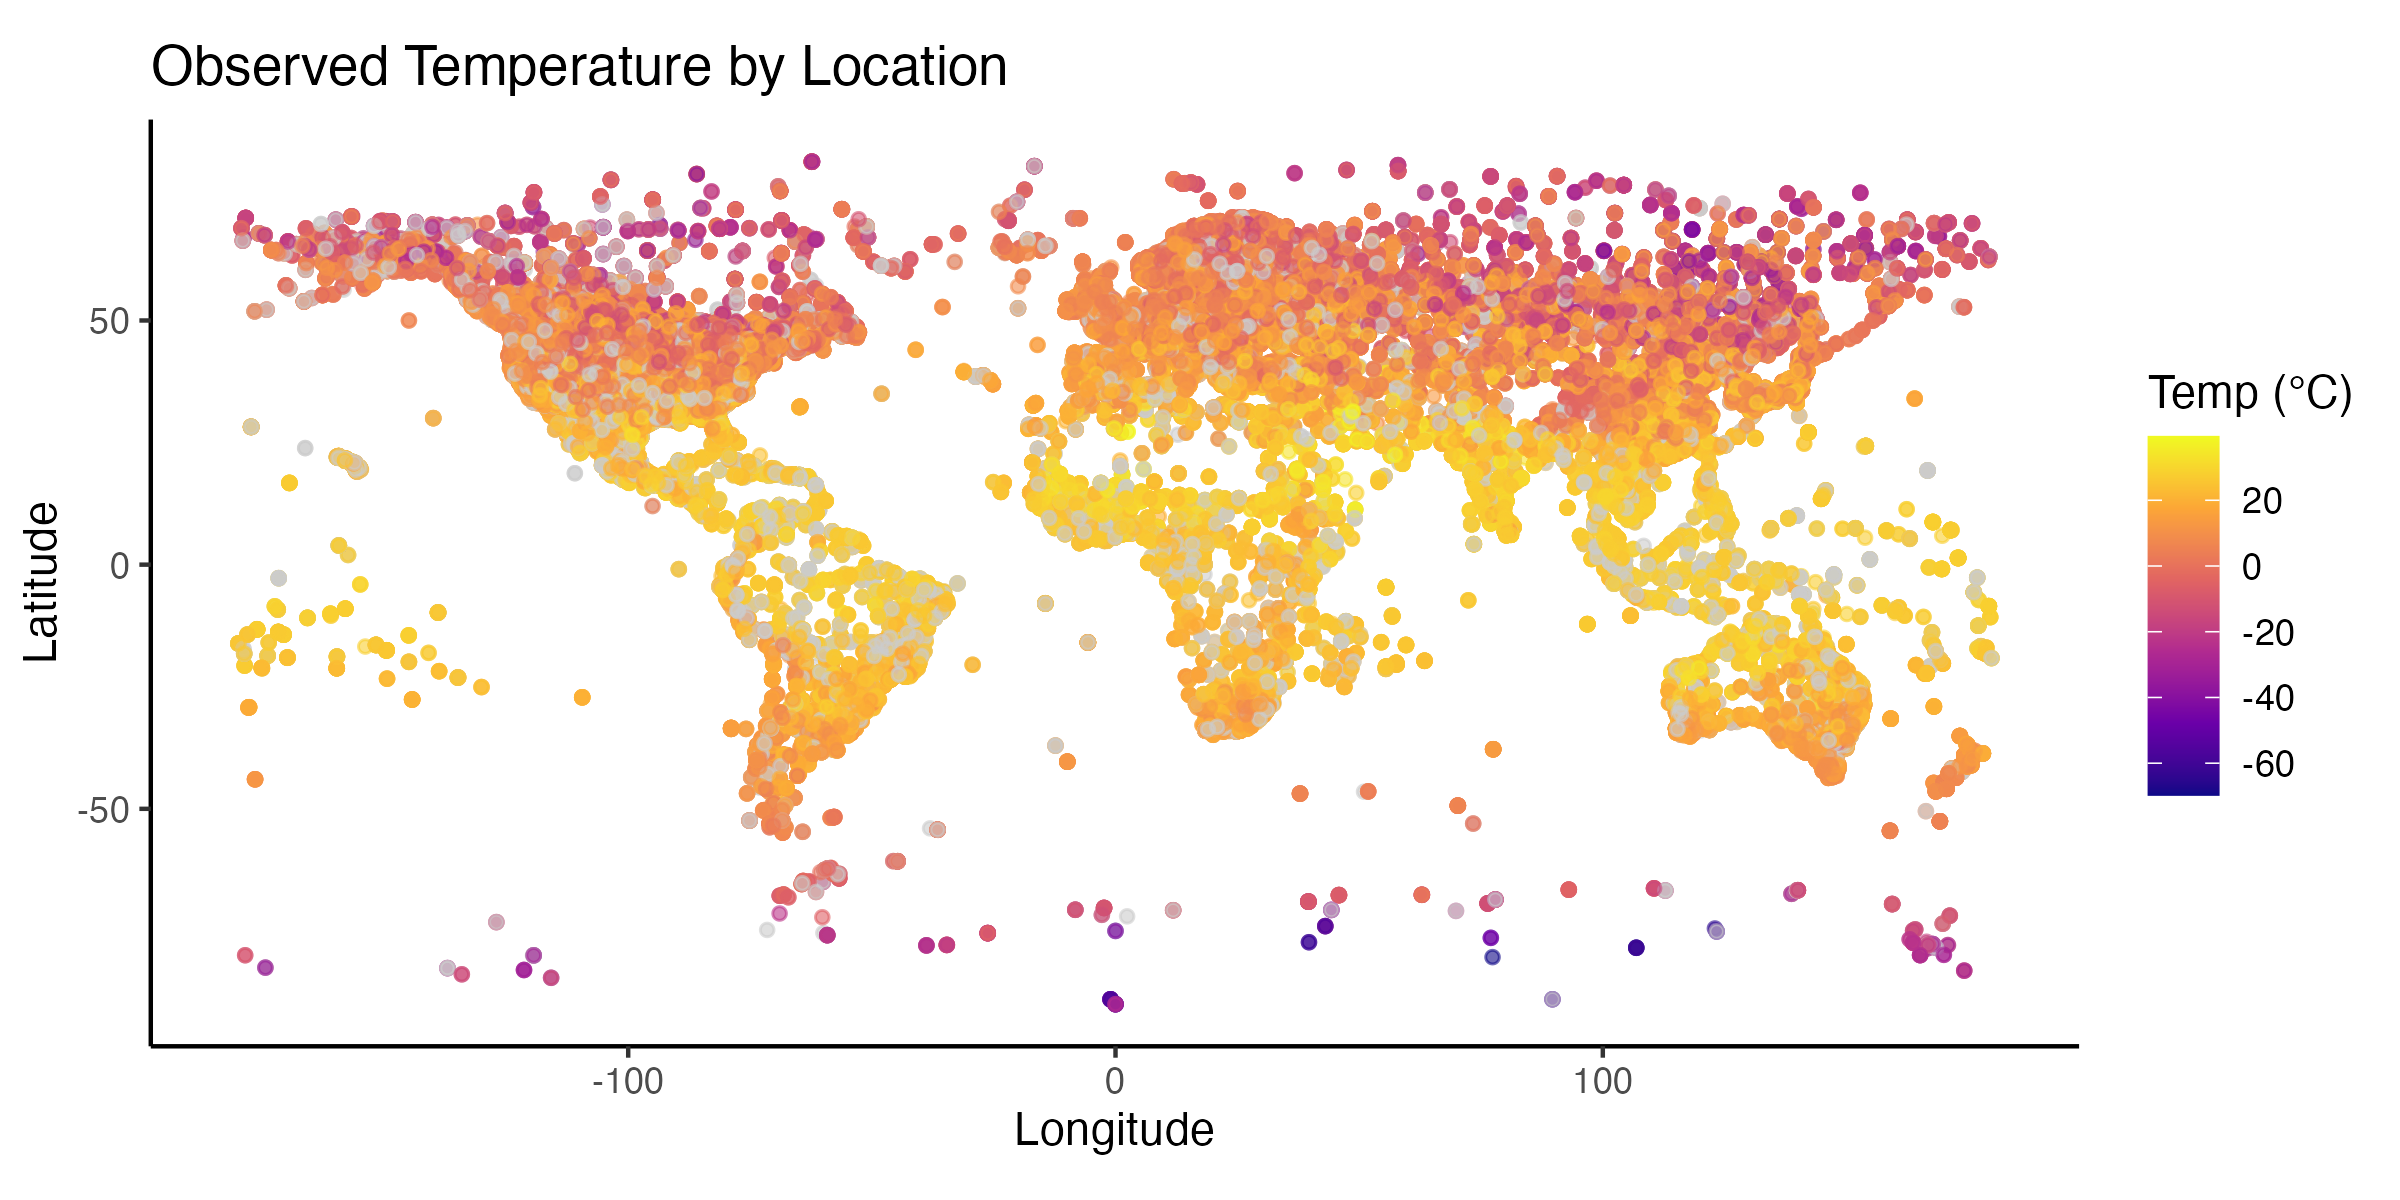
Temperatures at weather stations on a map
Scenario 2: Merge World Bank and V-Dem
See last week’s Merging Data slides for another example.
Treating Missing Values
Drop all NAs? Not always the best…..
Focus on what’s important
- Sometimes more column variables are important.
- Maybe the important cols here are Ozone and Temp (for a health study).
- If we drop ALL rows with any NA, we also lose rows where Ozone is recorded but Solar.R is missing — that’s throwing away useful information!
Summarize what you need
Better to extract the information you want — whatever you plan to analyze or plot — and then handle the NAs in those columns.
Heuristics / Rules of Thumb
- Select columns of interest (so you don’t have to worry about the rest)
- Use
drop_na(col1, col2)to handle specificallycol1andcol2
- Replace missing values with something that makes sense (imputation)
- Filter out rows given your assumptions
Sometimes missing things don’t come as actual
NAs!
Alternatives to dropping NAs
- imputation = replacing missing values with a reasonable substitute
- recoding = treating missing values as their own category or code
Other useful tidyr functions
pivot_longer() — why would you need this?
- Maybe you get data and the data has columns that are years
- Variables like time should be a single column so you can use tidy data functions
- Three basic arguments:
cols      # which columns you want to pivot
names_to  # the name of the column where the old column names are going
values_to # the name of the column where the values are going